Supply Chain Disruptions Have Eased, But Remain a Concern


Supply chain disruptions became a major headache for businesses in the aftermath of the pandemic. Indeed, in October 2021, nearly all firms in our regional business surveys reported at least some difficulty obtaining the supplies they needed. These supply chain disruptions were a key contributor to the surge in inflation that occurred as the economy recovered from the pandemic recession. In this post, we present new measures of supply availability from our Business Leaders Survey and Empire State Manufacturing Survey that closely track the New York Fed’s Global Supply Chain Pressure Index (GSCPI). We will begin publishing these data on a monthly basis starting in June. These indexes indicate that supply availability had generally been improving since early 2023, but over the past couple of months, improvement has stalled. This trend is concerning since our May Supplemental Survey indicates that between a third and a half of businesses in the region are experiencing difficulties obtaining supplies, and many are reducing operations and raising prices to compensate, though to a lesser extent than a few years ago.
A New Supply Availability Index
In October 2021, we began asking businesses in our surveys if supply availability had improved, remained unchanged, or worsened compared to the prior month, allowing us to derive diffusion indexes of supply availability for both service firms and manufacturers. We calculate our new supply availability indexes (SAIs) as the share reporting that supply availability improved over the month minus the share that report supply availability worsened. Thus, positive values of the SAIs suggest that, on the whole, supply availability improved over the month for businesses in the region, and negative values suggest that supply availability worsened. This index is similar to the GSCPI, which integrates a wide array of international data to derive an index that presents a comprehensive summary of potential supply chain disruptions from around the world. Positive values for the GSCPI suggest supply pressures are above their historical averages—in other words, worse than normal—while negative values suggest supply pressures are better than normal. Thus, readings of the GSCPI can be thought of as similar to what positive and negative values of our SAIs measure (a monthly change), though with the signs reversed.
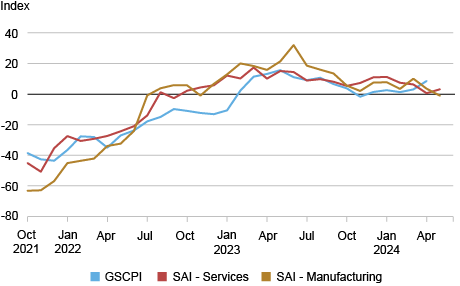
In the chart below, we show our new SAIs together with the GSCPI for the period our surveys overlap (the GSCPI starts in 1997). For comparability, we flip the sign on the GSCPI to correspond to our SAIs, so that positive values on the chart indicate fewer supply disruptions while negative values indicate greater supply disruptions and multiply the GSCPI by 10 to put it on the same scale as the SAIs.
Supply Availability Indexes Capture Global Supply Chain Disruptions

Notes: GSCPI is Global Supply Chain Pressure Index. SAI is supply availability index.
All three supply indexes closely track each other. The indexes generally remain below and above zero at the same time, and movements in the indexes correlate quite closely. These patterns suggests that supply chain disruptions faced by regional firms correspond to global disruptions, which is to be expected since firms often source their supplies from around the world, either directly or indirectly. However, the series exhibit somewhat different trends in late 2022. Our indexes turned positive (indicating improvement) in August 2022 while the GSCPI remained negative and edged down for some months before turning positive in early 2023. This divergence may well be due to differences between supply availability in the U.S. relative to the world more broadly. In particular, the Russia-Ukraine war was progressing at this time, affecting companies in Europe more directly than those in the U.S., and China experienced power outages in the summer of 2022 due to a record-breaking heat wave and drought, causing disruptions and closures of some shipping routes.
Notably, the three supply indexes have generally been above zero since early 2023, suggesting that supply availability has been improving for roughly the last year and a half, a period during which inflationary pressures moderated. However, over the past couple of months, the SAIs have hovered around zero, with the latest SAI-Manufacturing reading suggesting improvement has stalled. This trend is concerning as supplemental questions posed to businesses in the May survey indicate that supply disruptions remain significant for many firms in the region. Indeed, the recent lack of improvement in supply availability has occurred as inflation showed some stickiness.
Despite Progress, Business Activity Still Being Affected
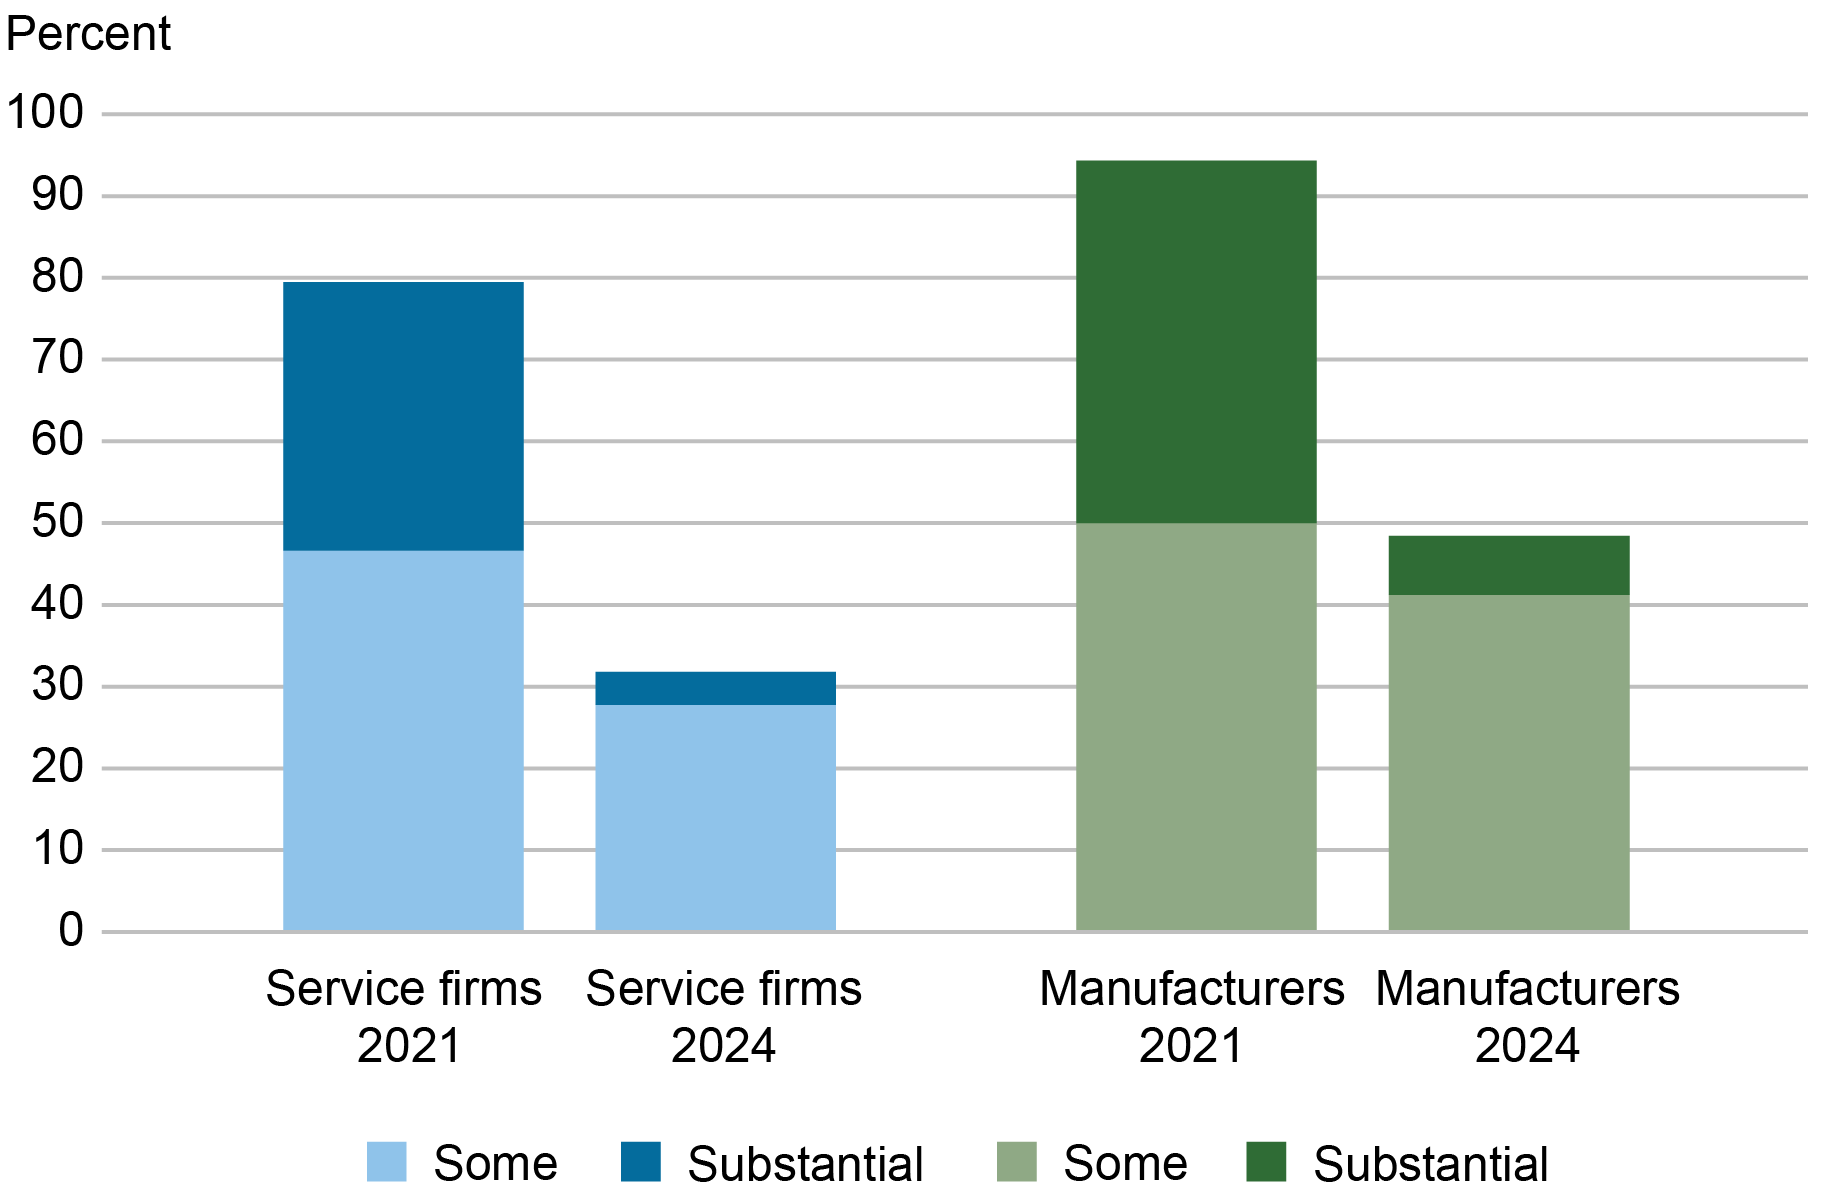
Our May business surveys asked firms how significant supply chain disruptions were over the month, a question which we also asked in October 2021. As shown in the chart below, while nearly 80 percent of service firms and almost 95 percent of manufacturers reported that they had difficulty obtaining supplies in October 2021, those shares have fallen to about a third of service firms and just under half of manufacturers in the May 2024 survey. Of note, the share of businesses reporting substantial supply disruptions has fallen considerably to just a small proportion.
Supply Chain Disruptions Have Subsided but Still Affect a Significant Number of Firms

And while roughly 70 percent of service firms and 90 percent of manufacturers reported that supply disruptions were impeding business activity in October 2021, those shares have fallen to 24 percent and 43 percent in May 2024. All in all, while much progress has been made, supply chain disruptions remain significant and are restraining business activity for many firms in the region, though much less so than in 2021.
How Are Businesses Coping?
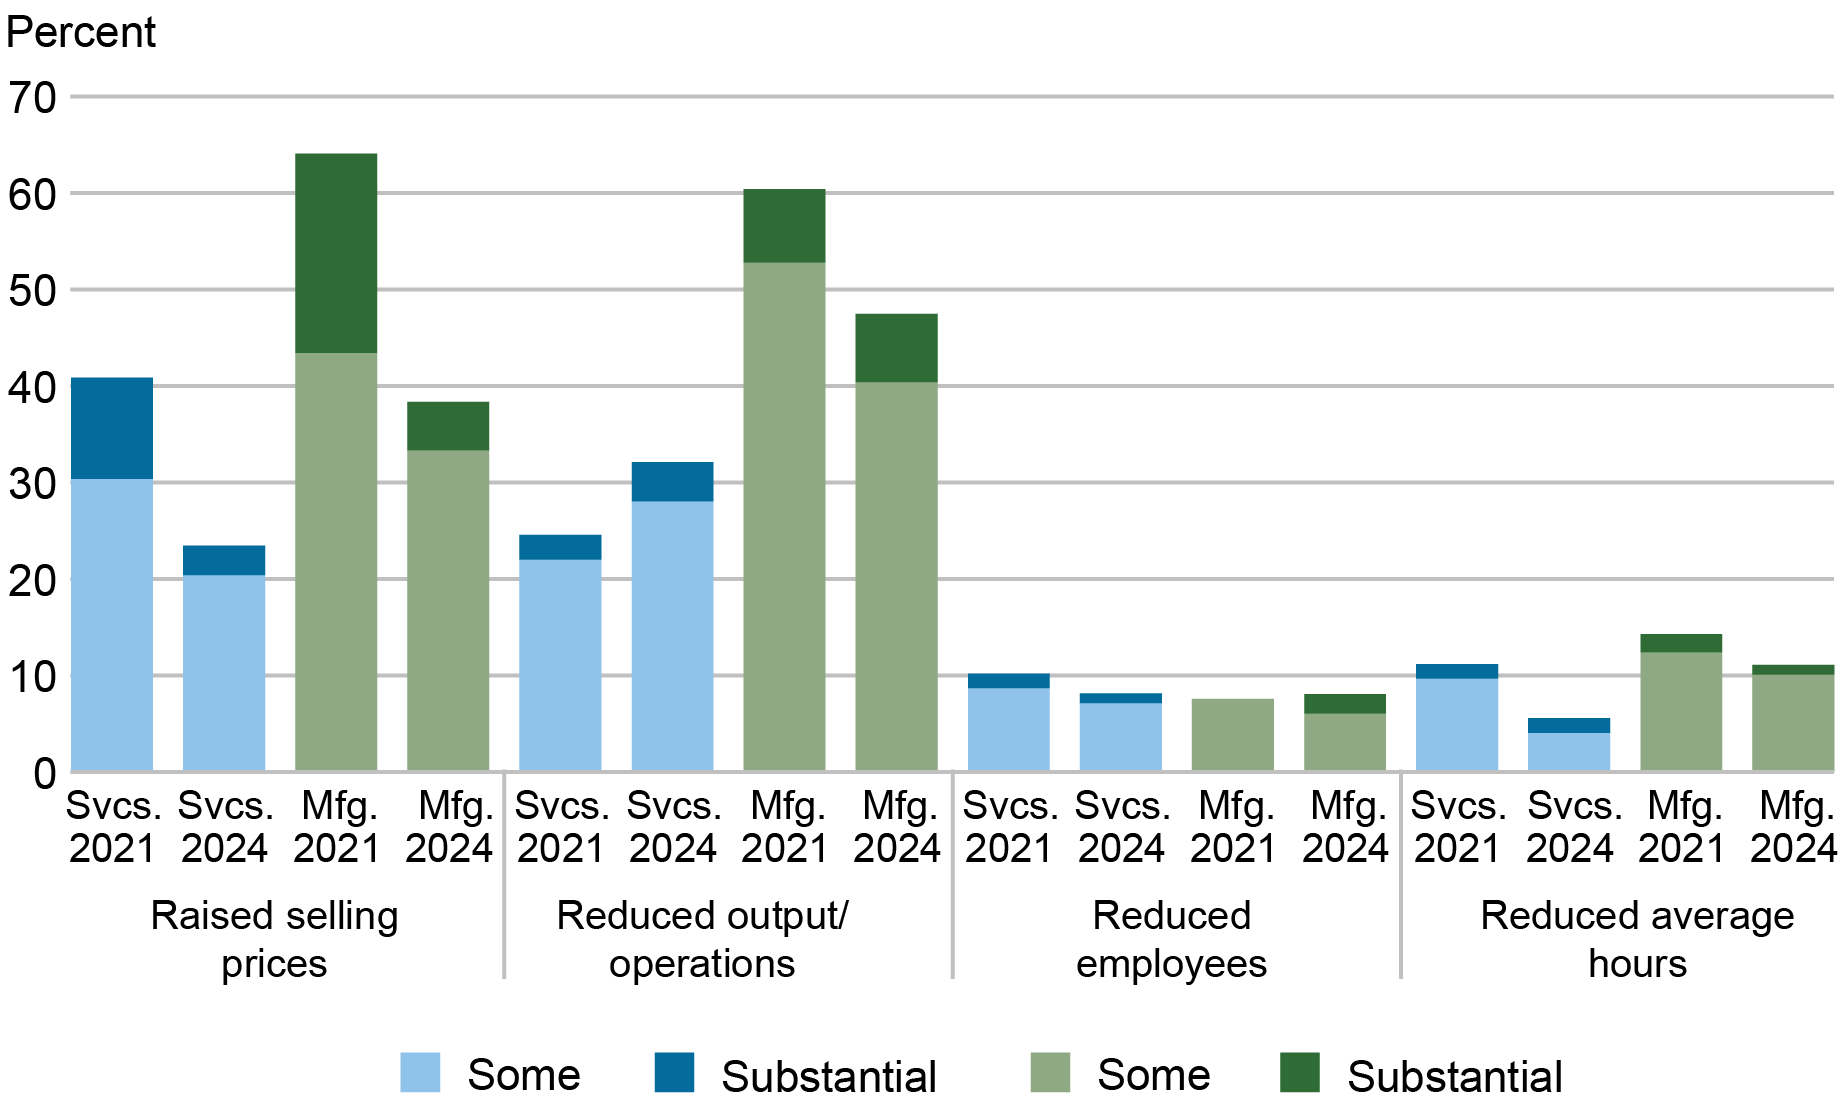
We also asked businesses what actions they had taken in response to supply chain disruptions over the past three months, focusing on changes to prices, output, employment, and hours worked. As the chart below shows, about a quarter of service firms and nearly 40 percent of manufacturers increased their selling prices. While such price adjustments were much less common than in October 2021, such high shares of firms raising prices in response to supply chain disruptions may well be contributing to inflationary pressures in the economy.
Actions Taken Due to Supply Chain Disruptions

About a third of service firms reported reductions in business operations due to supply chain disruptions, a higher share than the 25 percent who reported such reductions in 2021, while just under half of manufacturers said they had scaled back output, below the 60 percent who said so in 2021. Cuts to employment or hours worked were not very common, similar to 2021.
Conclusion
Supply chain disruptions emerged as a major issue as the economy began to recover from the pandemic recession and have been a key contributor to high inflation since then. As such, understanding and measuring supply chain disruptions are an important element in understanding inflationary pressures in the economy. Our supply availability indexes (SAIs) present a new gauge to measure such disruptions and have the advantage of being released early in the month as part of our regular regional business surveys, before many other indicators are available. Our May release, together with our supplemental survey, shows that supply disruptions are much less significant than a few years ago when there were significant imbalances in the economy, though supply availability has not been improving over the past couple of months. Our survey results indicate that many firms are raising prices due to supply disruptions at a time when there has been a lack of further improvement in supply availability, a troubling combination when inflation remains above the Federal Reserve’s inflation goal.

Jaison R. Abel is the head of Urban and Regional Studies in the Federal Reserve Bank of New York’s Research and Statistics Group.

Richard Deitz is an economic research advisor in Urban and Regional Studies in the Federal Reserve Bank of New York’s Research and Statistics Group.
How to cite this post:
Jaison R. Abel and Richard Deitz , “Supply Chain Disruptions Have Eased, But Remain a Concern ,” Federal Reserve Bank of New York Liberty Street Economics, May 20, 2024, https://libertystreeteconomics.newyorkfed.org/2024/05/supply-chain-disruptions-have-eased-but-remain-a-concern/.


