Throughout the twentieth century, steady technological and organizational innovations, along with the accumulation of productive capital, increased labor productivity at a steady rate of around 2 percent per year. However, the past two decades have witnessed a slowdown in labor productivity, measured as value added per hour worked. This slowdown has been particularly stark in the manufacturing sector, which historically has been a leading sector in driving the productivity of the aggregate U.S. economy. What makes this slowdown particularly puzzling is the fact that manufacturing accounts for the majority of U.S. research and development (R&D) expenditure. Despite several recent studies (see, for example, Syverson [2016]), much remains to be uncovered about the nature of this slowdown. This post illustrates a key facet of the mystery: the productivity slowdown appears to be pervasive across industries and across firms of various sizes.
The Labor Productivity Slowdown in U.S. Manufacturing
We start with the chart below, which shows labor productivity of the U.S. manufacturing sector from 1987 to 2022, based on the industry-level data from the Bureau of Labor Statistics (BLS). The index of labor productivity in the U.S. manufacturing sector is defined as the real value added of the industry per hour of labor, where the industry is classified at the NAICS three-digit level. The chart shows the resulting series both based on the current share of each industry in the total employment of the sector (solid blue line) and based on those industry shares fixed to their 1987 values (dotted blue line).
Labor Productivity Slows Down Beginning in the Late 2000s
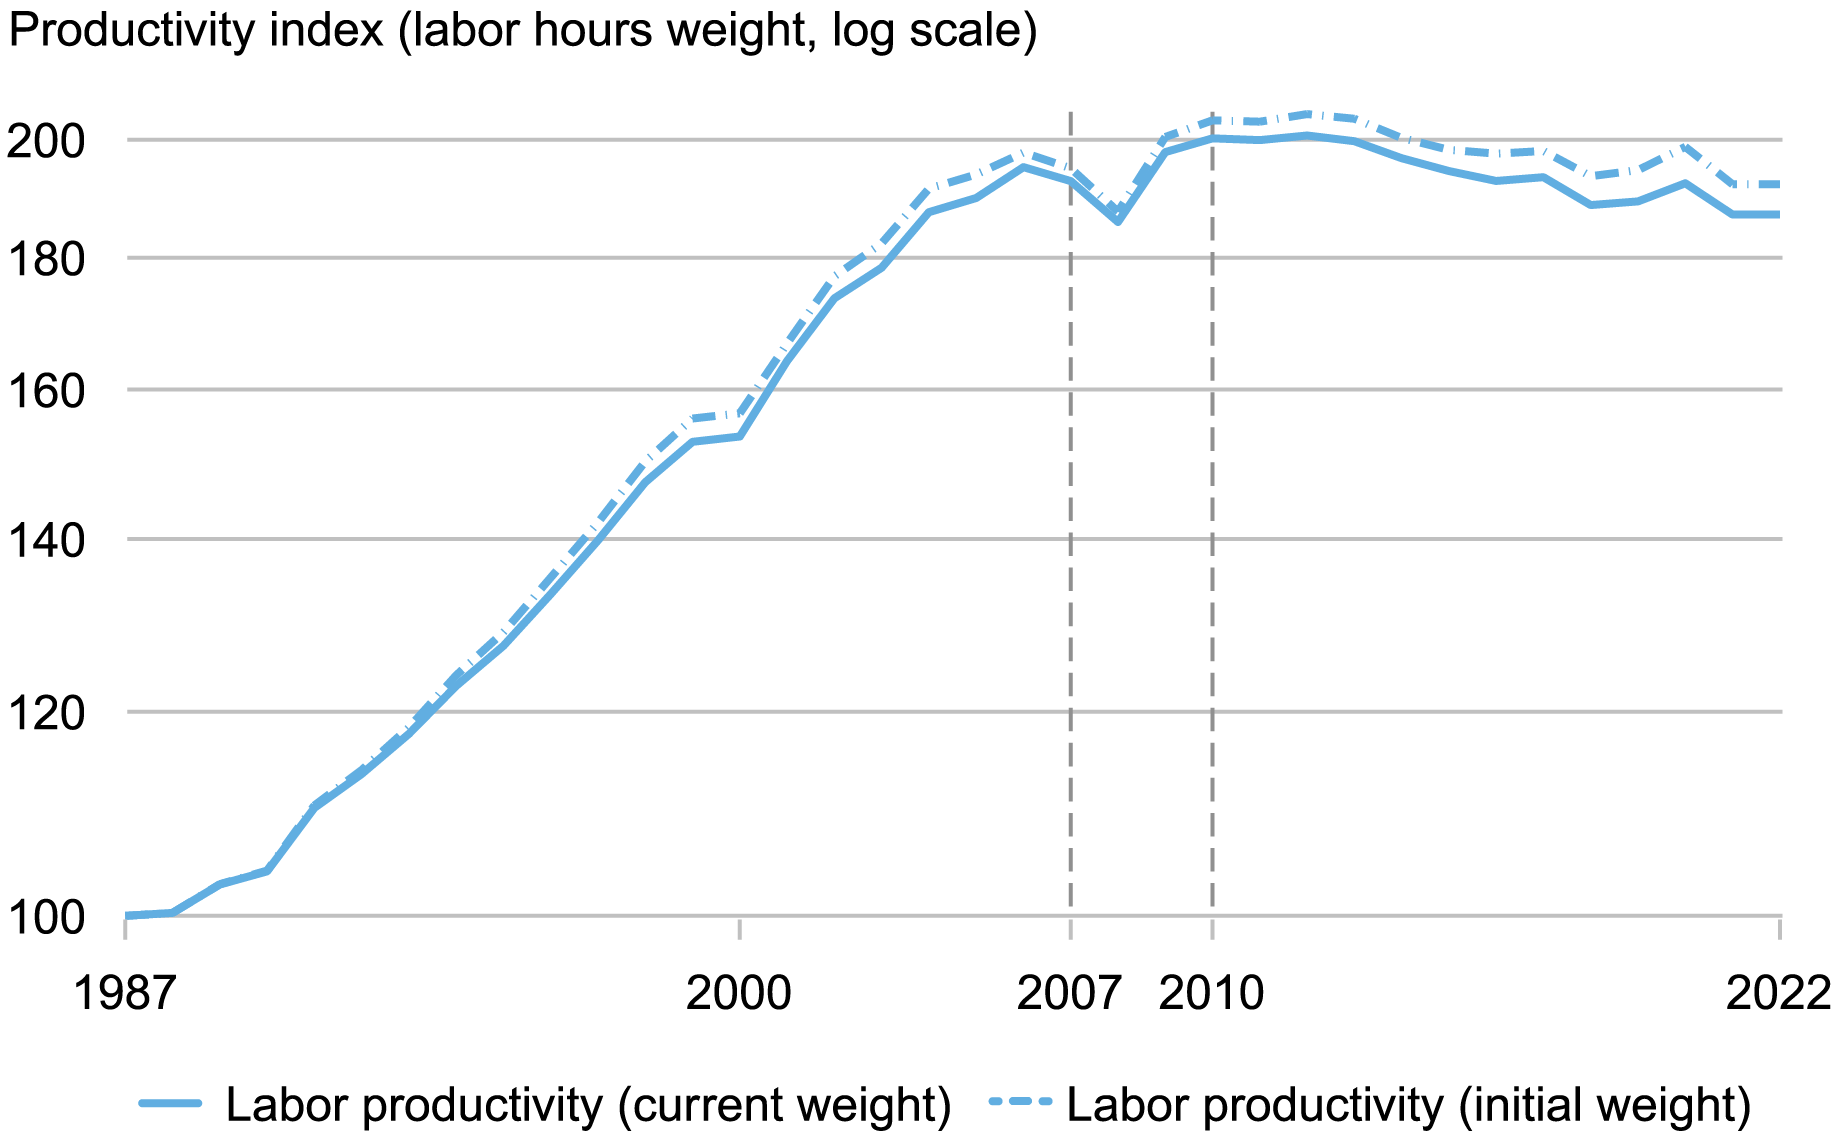
Notes: This chart shows the aggregate labor productivity index from the BLS. It calculates the growth in each industry classified at the NAICS three-digit level and computes the aggregate productivity index through the share of each industry in total employment in manufacturing, as defined by labor hours. The initial values are normalized to be equal to 100 in 1987.
The stagnant productivity since the late 2000s contrasts with the rapid growth over the preceding decade (late 1990s and early 2000s), which was representative of the sector’s historical experience throughout the late nineteenth and twentieth century. The change in the growth rate is stark. As the table below shows, labor productivity grew at an average of 3.4 percent per year from 1987 to 2007, whereas measured growth in labor productivity was –0.5 percent from 2010 to 2022, implying a slowdown of 3.9 percentage points per year.
Alternative Measurement Approaches Show the Slowdown in Productivity Growth
| Growth Measure | 1987-2007 Annual Growth | 2010-22 Annual Growth |
|---|---|---|
| Labor productivity | 3.4% (3.3%) | -0.5% (-0.6%) |
| TFP | 1.4% (1.4%) | 0.1% (0.1%) |
| Labor productivity of leading industries | 6.5% (6.6%) | -0.6% (-0.7%) |
| Labor productivity of following industries | 1.9% (1.7%) | -0.6% (-0.5%) |
| Revenue LP of public firms | 3.5% (3.6%) | -1.3% (-1.2%) |
| Revenue LP of leading public firms | 3.7% (3.8%) | -0.5% (-0.4%) |
| Revenue LP of following public firms | 2.6% (2.8%) | -1.3% (-1%) |
Source: Authors’ calculations based on the Compustat and Bureau of Labor Statistics (BLS) Productivity Accounts.
Notes: LP and TFP stand for labor productivity and total factor productivity, respectively. The growth rates inside the parentheses report the values if the industry shares are fixed at their initial values in 1987. The data underlying the first five rows are calculated based on the BLS productivity accounts and the data for public firms comes from the Compustat data set. Leading industries are the top four industries in terms of their average labor productivity growth in the 1987-2007 period, and the following industries are the remainder of the industries. The leading public firms are the top four firms in each industry every year based on their average share of Compustat industry employment in the two years over which the growth rate is calculated. The numbers in parentheses contain the growth rate fixing the initial industry shares in each case.
A natural first question is whether this slowdown stems from a gradual shift of production towards underperforming manufacturing industries or the slowdown is occurring within each manufacturing industry. The chart below shows that the slowdown appears among both the fastest- and slowest-growing industries. When we evaluate the four fastest-growing industries in terms of labor productivity from 1987 to 2007 (computers and electronics, textile mills, transportation equipment, and electrical equipment), these industries still exhibit a productivity slowdown from 2010 to 2022, from 6.5 percent in the pre period to -0.6 percent in the post period.
Productivity Growth in Both Leader and Follower Industries Slows Down Beginning in the Late 2000s
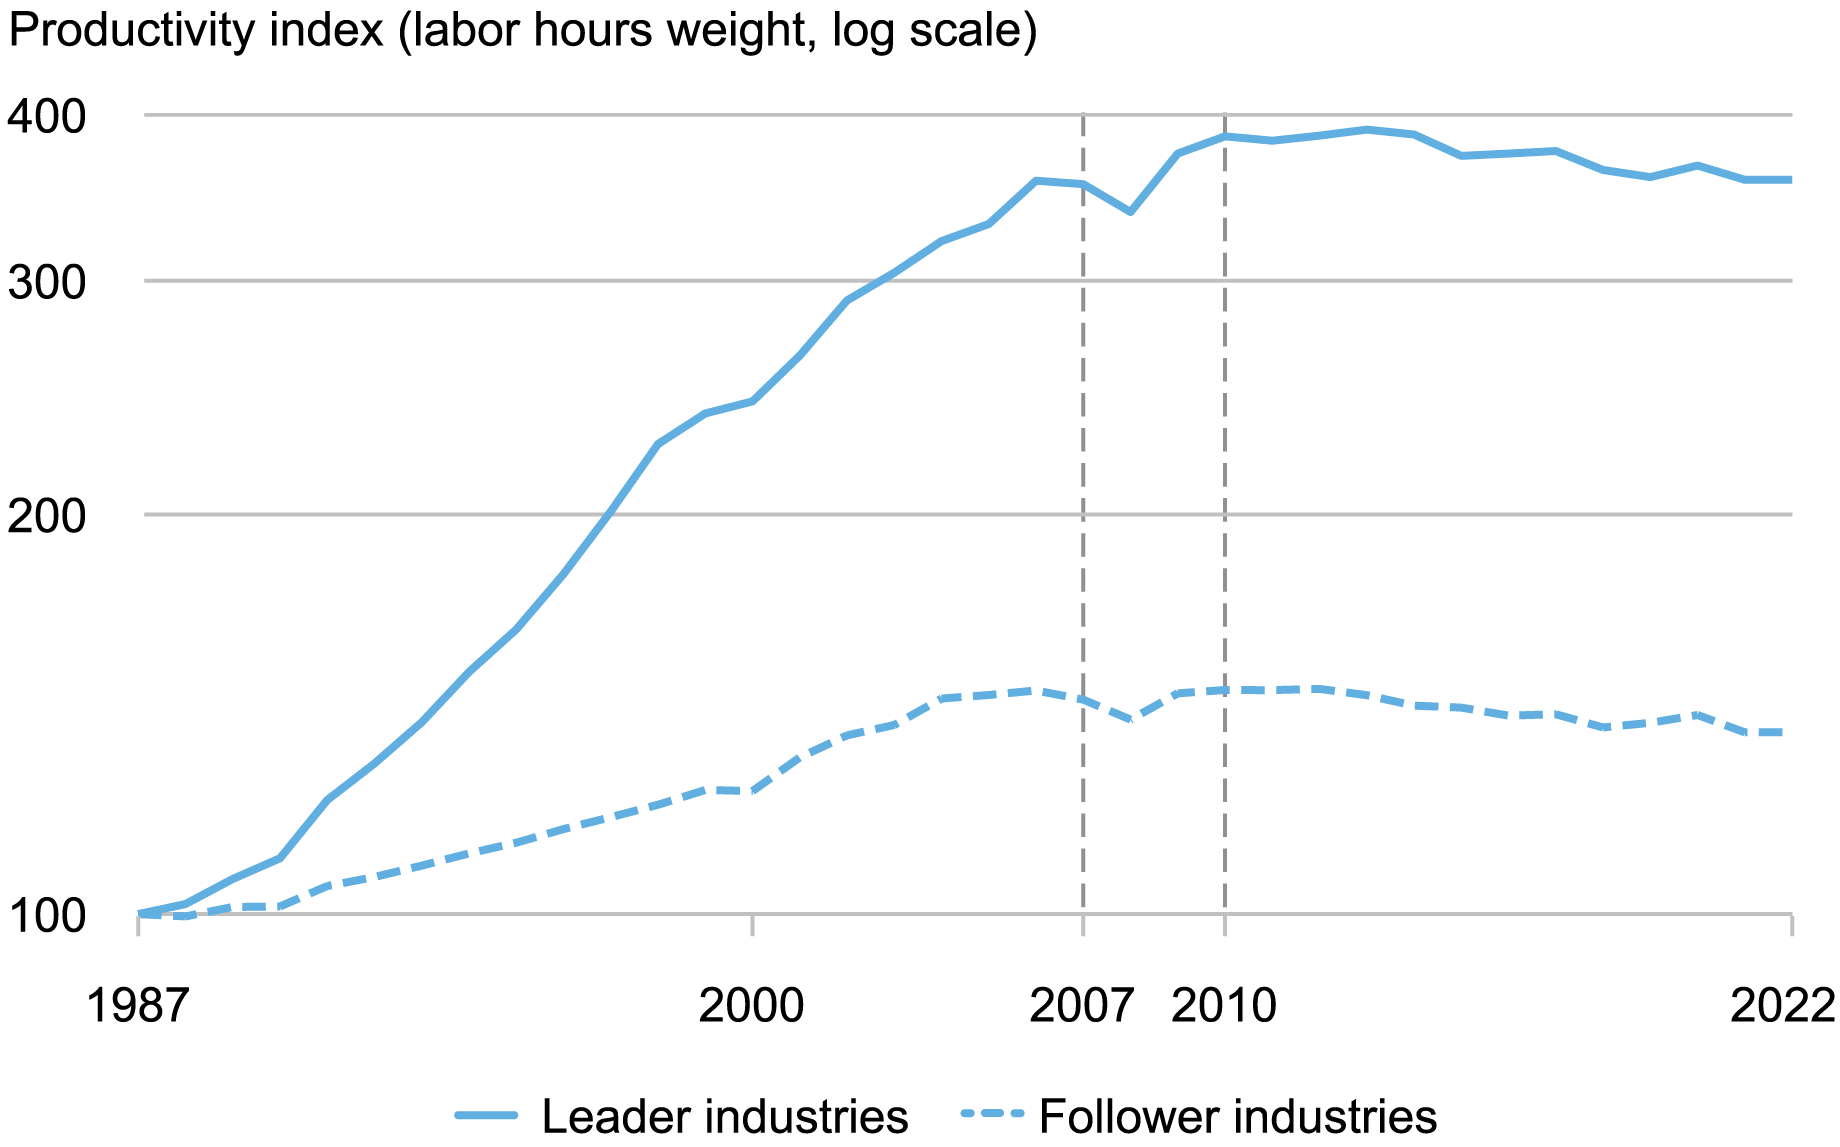
Notes: This chart shows the aggregate labor productivity index from the Bureau of Labor Statistics (BLS) and splits by the four fastest-growing industries from 1987-2007 (“leader industries”) and the rest (“follower industries”). It calculates the growth in each industry at the NAICS three-digit level and computes the aggregate productivity index within each group through the share of each industry in total employment in manufacturing, as defined by labor hours. The initial values are normalized to be equal to 100 in 1987.
Thus, most manufacturing industries, even those exhibiting stellar productivity gains in the 1990s, suffered a sustained productivity slowdown after the Great Recession. This fact is particularly puzzling in light of the widespread adoption of automation machinery and robots (see, for example, Acemoglu and Restrepo [2020], which one might expect leads to a rise in labor productivity.
Total Factor Productivity vs. Labor Productivity
One of the leading drivers of labor productivity is the amount of productive capital available to each employed worker in each industry. Is the fall in manufacturing labor productivity a byproduct of potentially weaker capital investment in the sector? To investigate this question, we examine the trends in manufacturing total factor productivity (TFP), which is a measure of labor productivity beyond what can be accounted for by the quantity and quality of capital and quality of labor. If the labor productivity slowdown is only driven by weak capital investments, then TFP should still be growing.
The next chart shows the trends in manufacturing TFP over the same period (1987-2022). Comparing the two charts, we still find a stark contrast between the observed rates of growth in TFP before and after the Great Recession. The average annual growth of TFP falls from 1.4 percent from 1987-2007 to 0.1 percent from 2010-22. With both labor productivity and TFP exhibiting significant declines in the industry-level data, we turn to microdata at the firm-level to further explore the nature of this decline.
Total Factor Productivity Growth Also Slows Down Beginning in the Late 2000s
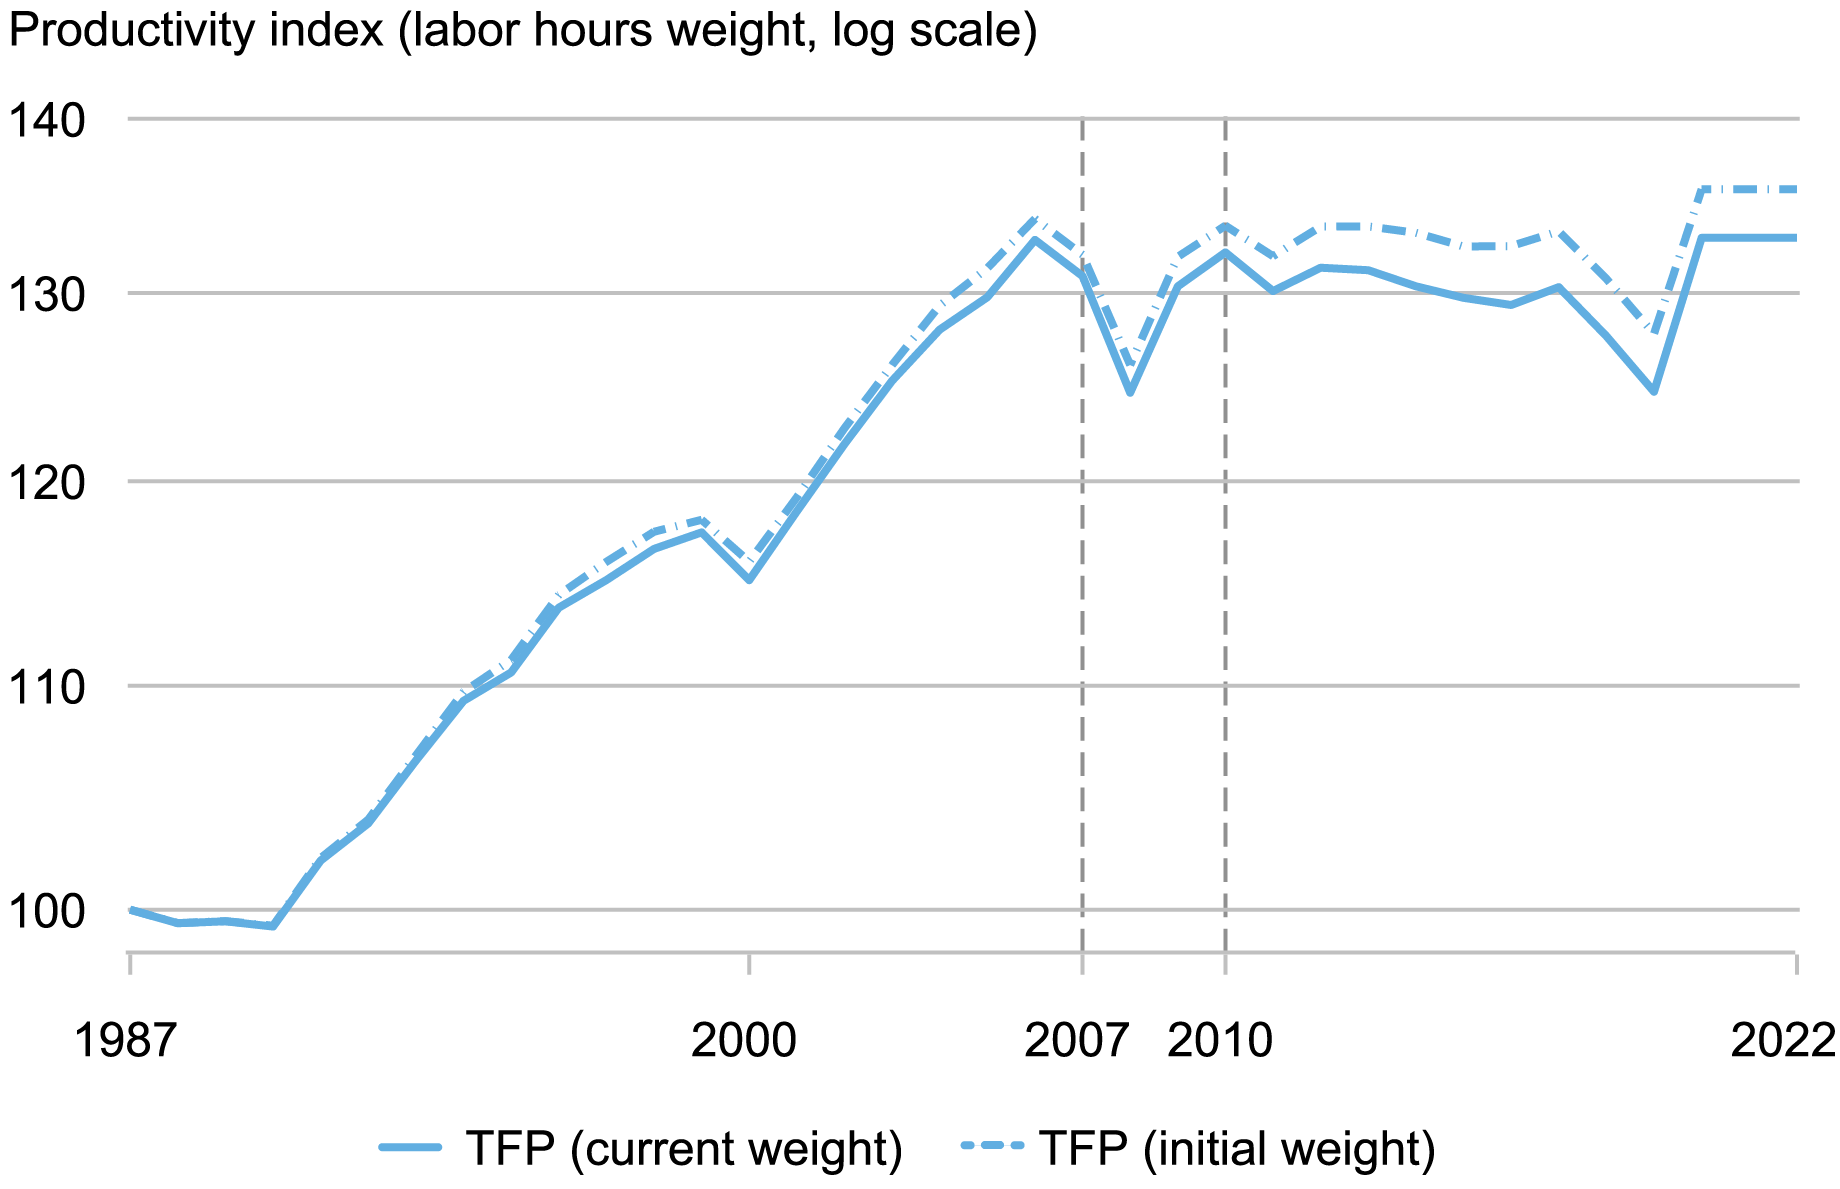
Notes: This chart shows the aggregate total factor productivity (TFP) index from the BLS. It calculates the TFP growth in each industry classified at the NAICS three-digit level and computes the aggregate productivity index through the share of each industry in total employment in manufacturing, as defined by labor hours. The initial values are normalized to be equal to 100 in 1987.
Productivity Slowdown from a Firm-Level Perspective
Several of the explanations proposed for the productivity slowdown point to a rise in the within-industry concentration and the emergence of superstar firms (Autor et al. 2020). For example, one theory focuses on a productivity gap between frontier firms and most other firms (as in, for example, Klenow, Li, and Naff [2019] and Akcigit and Ates [2023]). The idea is that, while the leading firms continue to innovate and grow in productivity and size, most remaining firms have fallen into productivity stagnation. The gap between the leading and laggard firms ultimately undermines the incentives of the frontier firms to continue to sustain fast productivity growth, as the prospects of competition from the other firms fades due to their stagnation.
The next chart presents alternative measures of the labor productivity of the U.S. manufacturing sector based on the available data on the balance sheets of U.S. public firms in manufacturing (the CRSP/Compustat data set). Publicly owned firms typically tend to be larger and more productive than privately owned firms.
Manufacturing Productivity Slowdown Stems from Productivity Slowdown at the Firm Level
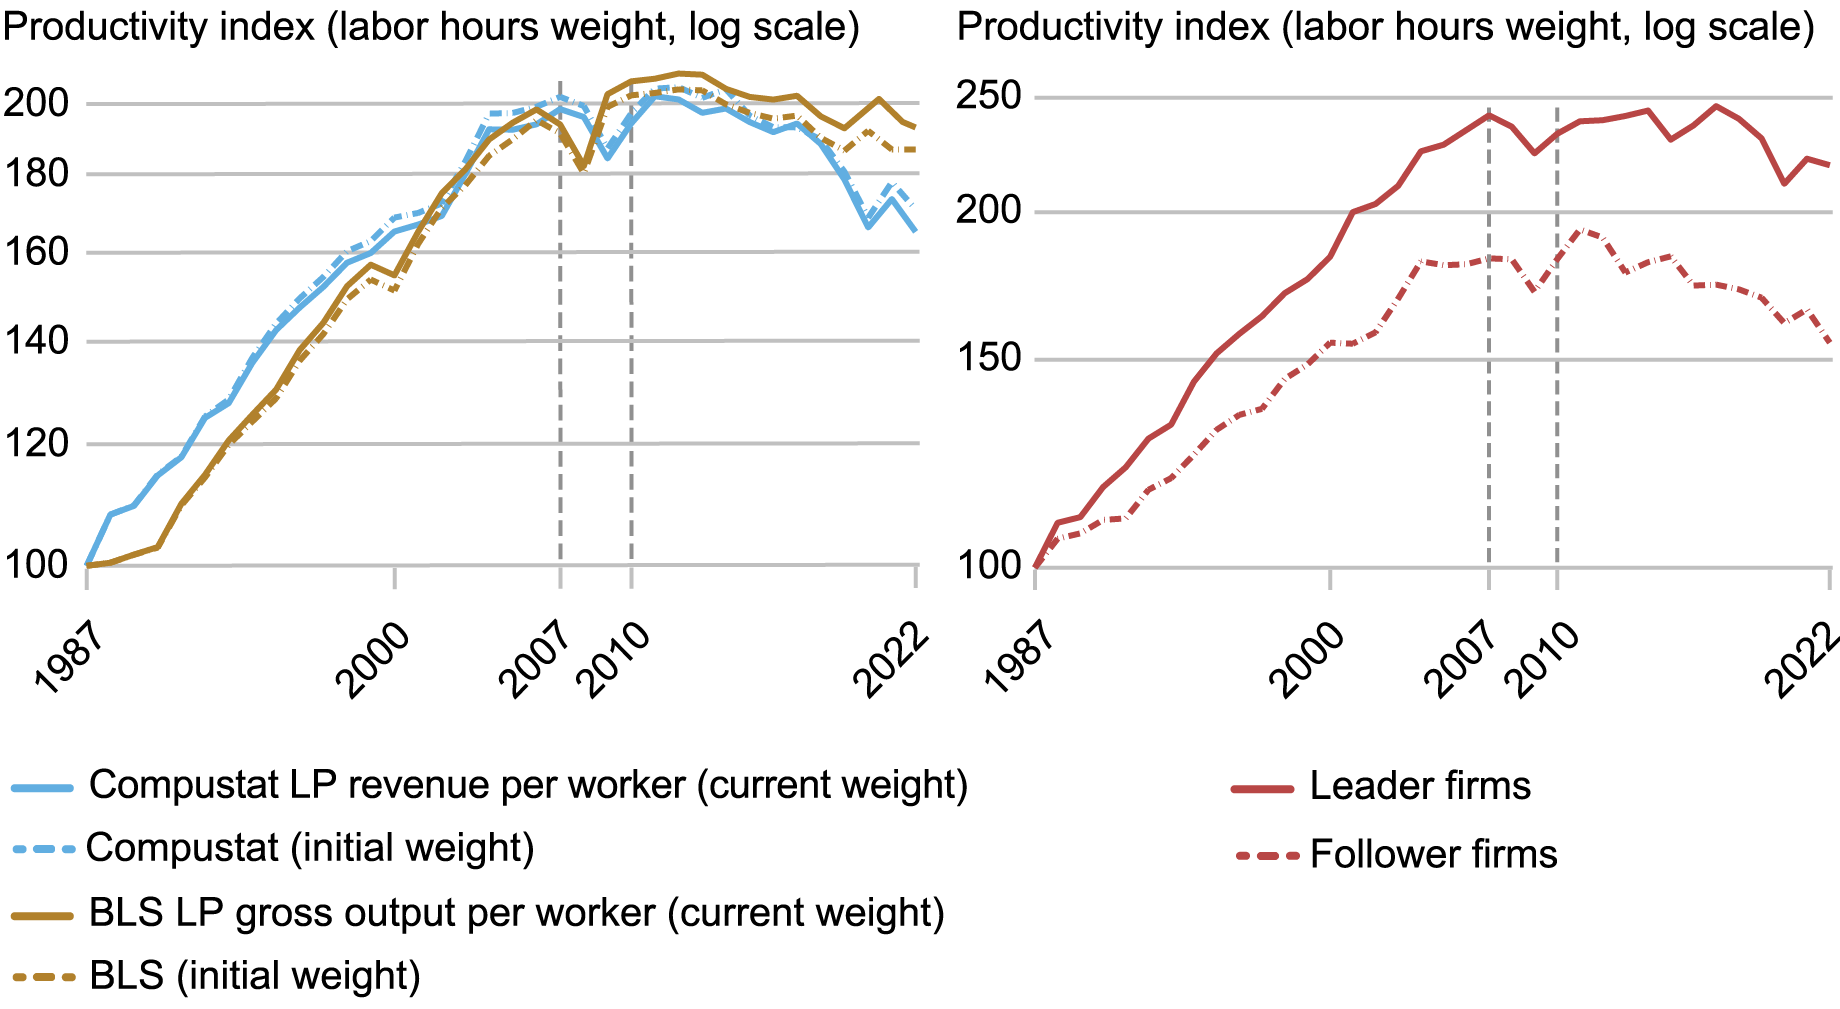
Notes: The left panel shows the revenue-labor productivity of Compustat firms against gross output labor productivity measured from the BLS data, following the same procedure as earlier charts, with fixed and varying industry shares with industries classified at the NAICS three-digit level. The right panel performs the same procedure and splits Compustat firms into leader and follower firms, as defined by the top four firms in each NAICS3 category in terms of average employment. The initial values are normalized to be equal to 100 in 1987.
Thus far, we have measured labor productivity as value added produced per hour worked. However, in the Compustat data, we only observe firm-level output in terms of revenue (a measure of gross output instead of value added) and firm-level labor inputs in terms of the number of workers. In the left panel of the chart, we show the trends for manufacturing labor productivity based on gross output per worker in the official BLS data set, which closely mirror the those found using value added per hour. The left panel additionally shows the same measure among the public firms in the industry observed in the Compustat data. We find that the public firms exhibit a similar slowdown in labor productivity as seen in the aggregates from the BLS data. From 1987 to 2007, the average annual real revenue growth per worker averaged 3.5 percent for firms in the Compustat sample, in line with the overall change in labor productivity. In the 2010-22 period, this measure of productivity dropped to – 1.3 percent.
The right panel splits this sample further by looking at the four largest firms in each industry, defined by employment, and the rest. Even within the leading firms in each industry, the patterns remain intact: a period of fast growth in the 1990s and early 2000s is followed by a period of stagnation starting in the mid-2000s. Similar patterns emerge when we instead use the top two firms or the very top firm in each industry (not pictured).
Leading firms appear to have played a larger role in the productivity boom in the 1990s. For these firms, the average labor productivity growth in the 1987-2007 period was 3.7 percent, while follower firms in Compustat experienced growth of 2.9 percent in the same period. From 2010 to 2022, both leading firms and following firms experience similar productivity growth declines. Leading firms show an average growth rate of –0.5 percent in the second period, a 4.2 percentage point reduction, while follower firms experience –1.3 percent growth, also a 4.2 percentage point reduction. Thus, the productivity slowdown appears to be a broad phenomenon affecting all industries and all firms in each industry. These findings diverge from the recent findings in the literature that focus on large firms separating from smaller firms (see, for example, Andrews et al. [2015]). While there is evidence of this separation, this looks to be mostly coming from growth in the 1990s and early 2000s.
Summing Up
The slowdown in labor productivity in manufacturing is one of the most important long-run issues in the United States that remains puzzling to economists and policymakers. This post points out that this development is common across industries and firms, with even the fastest-growing industries and the largest firms experiencing the slowdown. It is left to academics and policymakers to clear up the mystery about what factors are behind the ubiquitous slowdown in productivity.

Danial Lashkari is a research economist in Labor and Product Market Studies in the Federal Reserve Bank of New York’s Research and Statistics Group.

Jeremy Pearce is a research economist in Labor and Product Market Studies in the Federal Reserve Bank of New York’s Research and Statistics Group.
How to cite this post:
Danial Lashkari and Jeremy Pearce, “The Mysterious Slowdown in U.S. Manufacturing Productivity ,” Federal Reserve Bank of New York Liberty Street Economics, July 11, 2024, https://libertystreeteconomics.newyorkfed.org/2024/07/the-mysterious-slowdown-in-u-s-manufacturing-productivity/.
Disclaimer
The views expressed in this post are those of the author(s) and do not necessarily reflect the position of the Federal Reserve Bank of New York or the Federal Reserve System. Any errors or omissions are the responsibility of the author(s).