
After the Great Financial Crisis, the European Central Bank (ECB) extended its monetary policy toolbox to include the use of long-term loans to banks at interest rates close to zero or even negative. These central bank interventions were aimed at supporting the transmission of expansionary monetary policy and likely played a crucial role in bolstering the financial stability of the euro area, namely by reducing the chance of bank runs. However, quantitative evidence on the effects of these interventions on financial stability remains scant. In this post, we quantify the effectiveness of central bank lending programs in supporting financial stability through the lens of a novel structural model discussed in this paper.
Empirical Challenges in Assessing Central Bank Policies
The chart below illustrates the evolution of ECB lending to banks in euro area countries, based on a sample of banks covering roughly half of the total deposit and loan market. As we can see, most of this lending occurred after the euro area sovereign debt crisis. Lending rapidly accelerated during the COVID-19 pandemic, especially when the central bank expanded its balance sheet while reducing the interest rate at which banks could borrow from the central bank to as low as -1 percent (similar lending programs were implemented by the Bank of Japan and the Bank of England). The quantitative easing facilities launched in parallel by the ECB and many central banks around the world, unlike these lending operations, were not directly aimed at bolstering the stability of the banking system.
ECB Lending Facilities and the Policy Rate
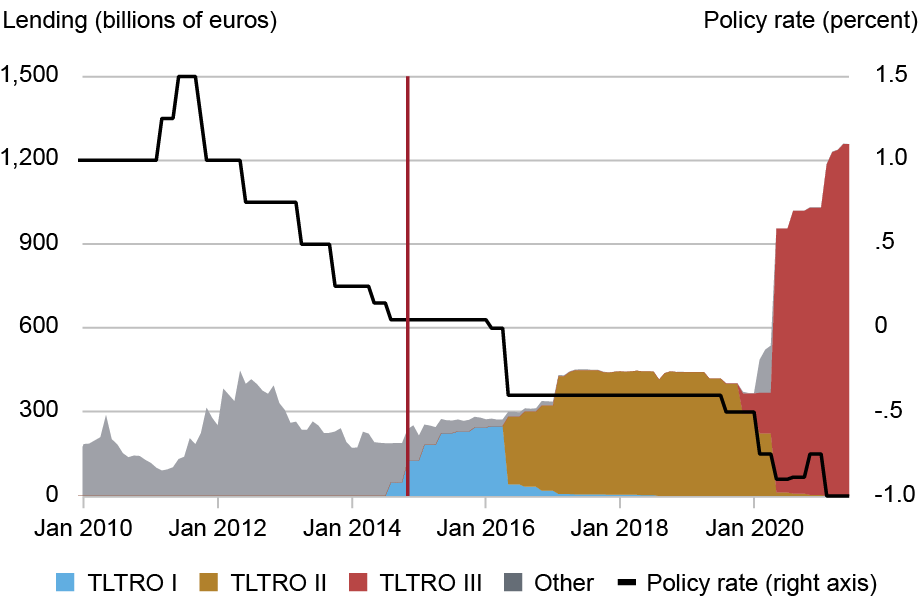
Notes: The chart presents the dynamics of the European Central Bank’s (ECB) lending and its policy rate over 2010-2021. TLTRO I, II, and III correspond to the Targeted Longer-Term Refinancing Operations announced respectively in June 2014, March 2016, and March 2019. The vertical red line indicates the beginning of the sample period. Policy rate is the borrowing rate applied to refinancing operations over time. The chart is based on a sample of banks corresponding to roughly 50 percent of overall loan and deposit volumes; this proportion is also reflected in the amount of ECB funding that the sample covers.
Despite the scale and direct impact on banks’ balance sheets, quantitative assessment of the effects of refinancing operations is hindered by a set of empirical challenges. First, to quantify the effectiveness of these interventions, one should compare similar episodes where central banks did or did not intervene. However, these measures were adopted when economic conditions were worsening, making it challenging to isolate the role of monetary policy. Second, bank runs can be averted even in the absence of an explicit central bank intervention, as depositors’ expectations of an intervention can be sufficient to assuage their fears and stop them from running on a bank. All of this makes it difficult to identify a suitable benchmark in the data (one in which economic conditions are similar but central banks do not intervene and bank runs materialize), thereby calling for a more formal analytical framework.
Financial Stability and the Central Bank Lending Rate
A recent paper by Albertazzi, Burlon, Jankauskas, and Pavanini overcomes these empirical challenges, quantifying the effectiveness of central bank lending programs through a structural framework of the euro area banking sector. The model features demand and supply in imperfectly competitive deposit and loan markets, as well as borrowers’ and banks’ default risk and the central bank’s funding facility. The structure of the model enables the identification of all alternative scenarios, including runs, that could have materialized, at each point in time and in each euro area country banking sector. By allowing us to evaluate how these scenarios are affected by central bank interventions, this framework provides a comprehensive benchmark for more in-depth policy assessment.
We start by displaying our model-implied alternative scenarios. The chart below presents the distribution of historical and model-implied bank default probabilities in euro area countries over 2014-2021. While the realized default probabilities (gray bars) exhibit substantial heterogeneity, the model reveals that the alternative scenarios are characterized by a visibly thicker right tail (blue bars). Namely, the model unveils scenarios exhibiting bank default probabilities of up to 50 percent. Since high default risk potentially carries large economic welfare costs, it is critical to consider such cases while assessing monetary policy implications.
Realized and Alternative Bank Default Probabilities
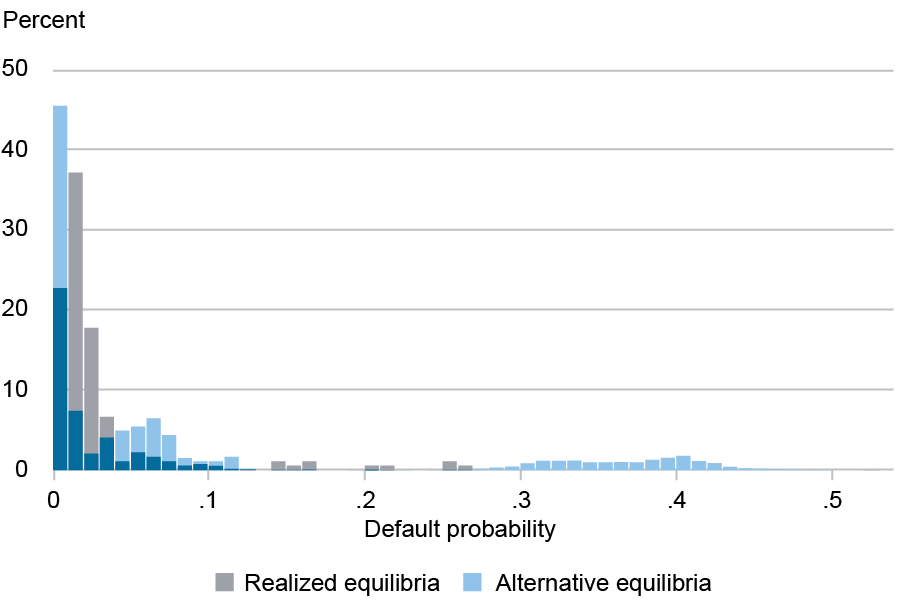
Notes: The chart presents the distribution of realized and alternative equilibria. “Realized equilibria” reflect the data (December observations from 2014 to 2020 plus July 2021 for the balanced panel of thirty banks). “Alternative equilibria” are the scenarios implied by the model. Dark blue bars are where the two equilibria overlap.
How did the central bank lending programs impact financial stability? Our framework sheds light on this question. We model the availability of central bank funding by varying the rates at which the central bank lends to banks, providing a stable source of financing in times of distress when flighty uninsured deposits may leave the banks. We use counterfactual simulations of the model to quantify the shadow value of the central bank’s interventions, documenting what would have happened to banks’ fragility if these policies had been more or less accommodative. We find that a 1 percentage point increase in the rate at which banks borrow from the central bank increases banks’ default probability by, on average, 1.8 percentage points. The chart below illustrates this effect by showing the distributions of scenarios with higher (positive numbers) and lower (negative numbers) policy rates. We can see that when the funding rate increases, the distribution of default probabilities shifts upward, with a pronounced effect on the upper tail (maximum) and the interquartile range. This highlights substantial stability gains stemming from central bank lending at lower rates.
Banks’ Default Risk Increases with Higher Policy Rates
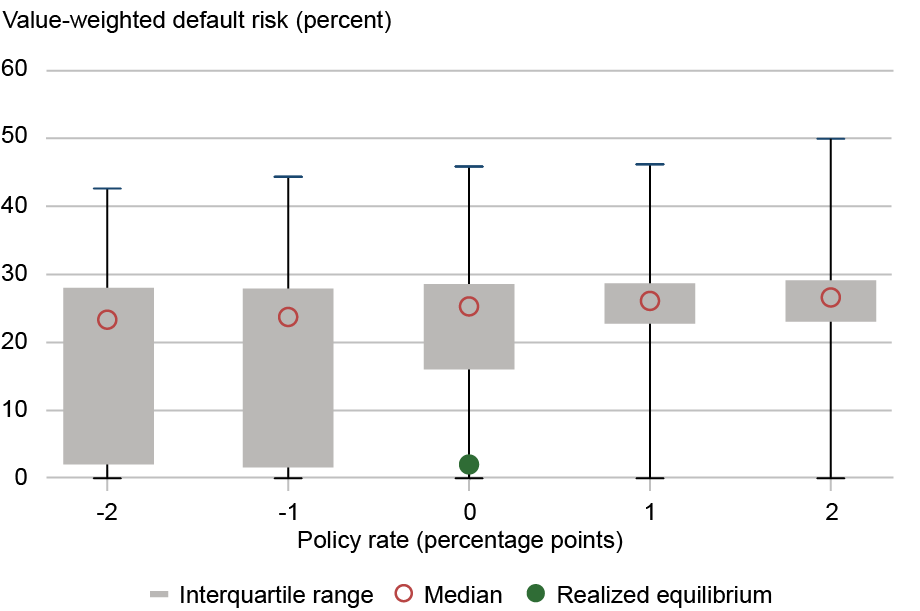
Notes: The chart displays the distribution of equilibria for each level of the policy rate and across country-year scenarios of banks’ default probabilities in levels. The black line shows the full range of the distribution, the gray area the interquantile range, the red empty circle the median, and the green solid circle the median of the realized equilibrium.
The comprehensive assessment of central bank interventions considers not only banks’ default probabilities but also the costs of these programs. We evaluate the interventions using a welfare concept that directly incorporates the monetary effects on expected deposit insurance costs, bank profits, and deposit and lending rates, which affect the well-being of depositors and borrowers. The chart below shows the distribution of welfare across scenarios and alternative policy rates. These distributions largely mirror those of default probabilities: scenarios with high bank-run risks are associated with large potential welfare losses (reflected in the tails).
Welfare Outcomes Improve with Lower Policy Rates
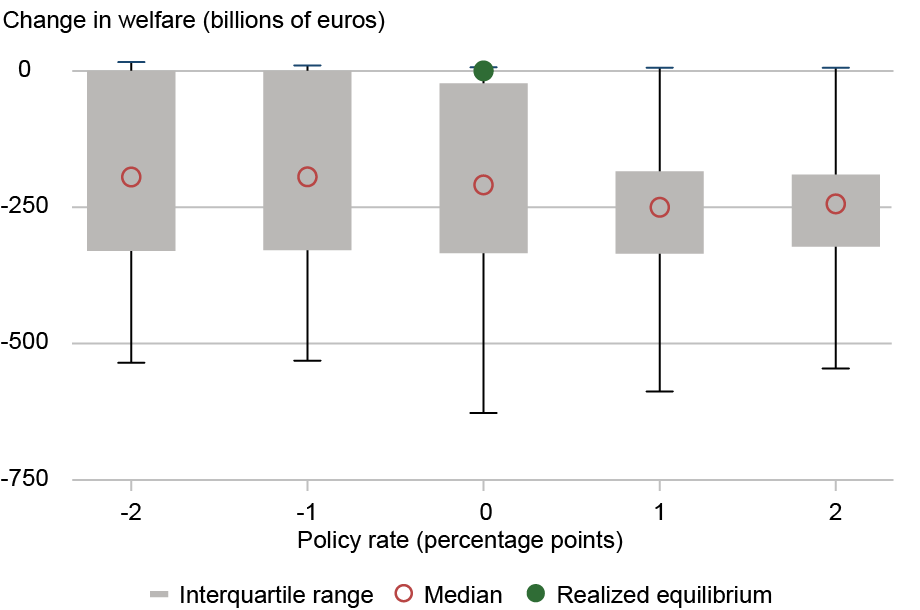
Notes: The chart displays the distribution of equilibria for each level of the policy rate and across country-year scenarios of total welfare in deviation from the realized equilibrium in billions of euros. The black line shows the full range of the distribution, the gray area the interquantile range, the red empty circle the median, and the green solid circle the median of the realized equilibrium.
We observe that lower lending rates lead to economic gains, suggesting that the central bank lending programs were welfare-improving. This effect was primarily driven by reduced bank risk, lower expected deposit insurance costs, and decreased lending rates for households and firms. At the same time, since lower policy rates were also transmitted to deposit rates, most of the negative effects are borne by depositors. While the overall welfare gain was positive, the multifaceted nature of monetary policy highlights the trade-offs policymakers face.
Conclusion
In this post, we quantify the impact that ECB lending facilities had on the euro area banking sector’s financial stability. To overcome empirical challenges in the assessment of these interventions, we rely on the novel model of Albertazzi, Burlon, Jankauskas, and Pavanini (2025), which enables the recovery of alternative scenarios and simulation of different policy counterfactuals. The model simulations show that these policies were particularly effective in reducing the risk of unwarranted and self-fulfilling runs and improving overall welfare.

Tomas Jankauskas is a financial research economist in the Federal Reserve Bank of New York’s Research and Statistics Group.
Ugo Albertazzi is an adviser in the Directorate General Macroprudential Policy and Financial Stability at the European Central Bank.
Lorenzo Burlon is a head of section in the Directorate General Monetary Policy at the European Central Bank.
Nicola Pavanini is a professor of finance and industrial organization at Tilburg University.
How to cite this post:
Tomas Jankauskas, Ugo Albertazzi, Lorenzo Burlon, and Nicola Pavanini, “The Shadow Value of Central Bank Lending,” Federal Reserve Bank of New York Liberty Street Economics, October 16, 2025, https://doi.org/10.59576/lse.20251016
BibTeX: View |
Disclaimer
The views expressed in this post are those of the author(s) and do not necessarily reflect the position of the Federal Reserve Bank of New York, the Federal Reserve System, the European Central Bank, or the Eurosystem. Any errors or omissions are the responsibility of the author(s).