

The Federal Reserve Bank of New York’s Center for Microeconomic Data recently released its Quarterly Report on Household Debt and Credit for the fourth quarter of 2025, revealing continued growth in household debt balances. Aggregate household debt balances rose by $191 billion to reach $18.8 trillion, marking a $4.6 trillion increase since the end of 2019. Mortgage balances grew by $98 billion to $13.2 trillion, while credit card debt increased by $44 billion to $1.28 trillion. Credit card and auto loan delinquency rates appear to have stabilized, albeit at elevated rates. By contrast, the delinquency rate for mortgages—although still near low levels on a longer-term basis—has been steadily increasing over the past few years. Underlying these aggregate figures, however, there are notable differences in mortgage credit performance across places with different income levels and labor and housing market dynamics. This analysis, as well as the Quarterly Report on Household Debt and Credit, are based on anonymous credit report data from Equifax.
While the stock of mortgage balances are held by borrowers with strong credit profiles relative to historic standards, mortgage delinquency rates increased in the fourth quarter. This deterioration has been most pronounced among borrowers living in lower-income zip codes. To illustrate this pattern, we use zip-code level adjusted gross income from the IRS Statistics of Income and categorize borrowers into four income groups of equal size.
The chart below breaks out the new 90+ days delinquency rates by these income groups. While borrowers in the lowest-income zip codes (quartile 1) have seen their 90+ day delinquency rates surge since 2021—rising from approximately 0.5 percent to nearly 3.0 percent by late 2025—those in the highest-income areas (quartile 4) continue to maintain historically lower delinquency rates. Although financial distress appears to be deepening for households in lower-income areas, borrowers in higher-income areas appear largely insulated from these pressures, at least as measured by mortgage delinquency. The middle-income quartiles show intermediate trends, with delinquency rates rising but not as precipitously as for the lowest income group.
Mortgage Delinquency Rates Return to Levels of Ten Years Ago
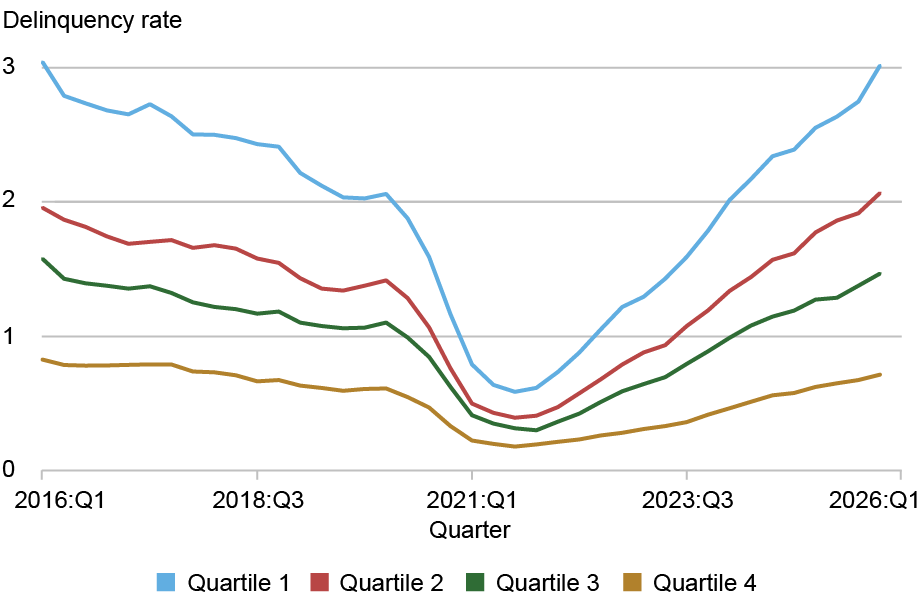
Notes: The chart plots new 90+ days delinquent mortgage balances by zip-income quartile. The lowest-income quartile is quartile 1; the highest-income quartile is quartile 4. Mortgage delinquency rates are at an annual rate, summing over the four quarters.
We next examine some potential factors that may be contributing to disparities in mortgage performance. Could worsening regional labor markets be associated with borrowers’ inability to remain current on their debts? The unemployment rate nationally bottomed out at 3.4 percent in April 2023 but has risen about 1 percentage point since then. Still, there is considerable regional heterogeneity: two-thirds of counties have seen their local unemployment rates rise, and 5 percent of the population lives in counties where unemployment rates have risen by more than 1.6 percentage points (these counties are disproportionally located in Florida and Minnesota). The chart below presents a binned scatter plot that reveals a correlation between local labor market deterioration and rising mortgage delinquency rates. We divide counties into twenty groups of equal population based on their one-year change in unemployment rate and compute how mortgage delinquency flows have evolved for each group. Counties experiencing the steepest increases in unemployment saw a notable worsening in mortgage delinquency by nearly 0.6 percentage points over the past year. In contrast, in counties where unemployment rates have remained stable or declined, the increase in newly delinquent mortgages has been relatively modest—around 0.2 percentage points. The upward-sloping fitted line illustrates this relationship, suggesting that as local labor markets weaken, households increasingly struggle to remain current on their mortgage obligations.
Counties with Rising Unemployment Rates Experience Rising Mortgage Delinquencies
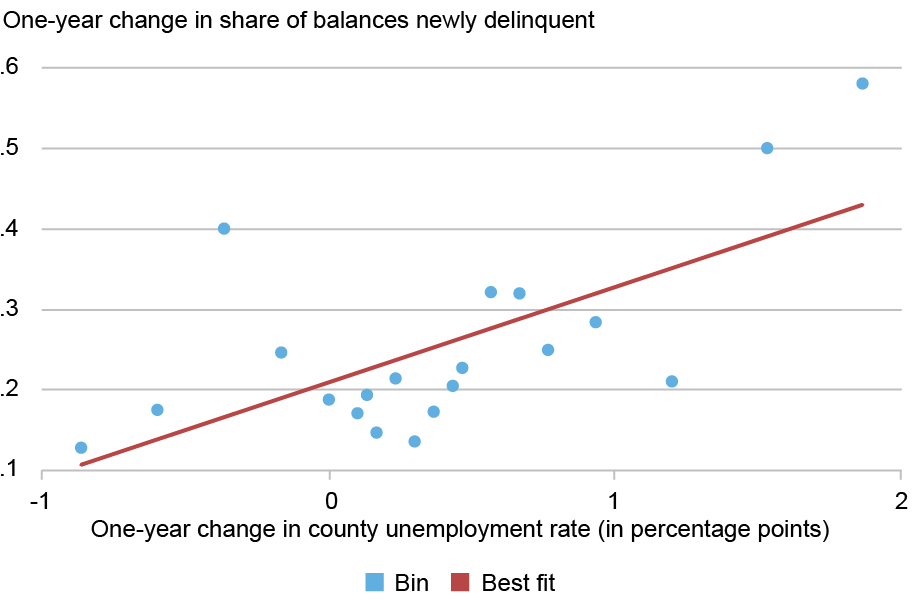
Notes: Counties are grouped into twenty bins based on the change in the unemployment rate, with the median change within each bin reported on the x-axis. Bins are weighted using 2022 county population from the ACS. Flow delinquency rates are calculated by grouping borrowers by bins of county unemployment change.
Next, we consider whether local housing market conditions may help explain differential performance in mortgage repayment. As of November 2025, home prices in the United States were up by 1.0 percent nationally since the previous year but the national change masks enormous regional variation. When we consider a more regional look into the evolution of home prices, we see that some areas of the country, such as along the Gulf Coast of Florida, have seen pronounced declines in home prices. The chart below plots the change in area home prices, using the Cotality/CoreLogic Home Price Indices at the zip-code level, against the change in mortgage delinquency rates. Mortgage delinquency rates are negatively associated with the pace and direction of home price changes, although this relationship is not as strong as the relationship with unemployment.
Counties with Falling House Prices Experience Rising Mortgage Delinquencies
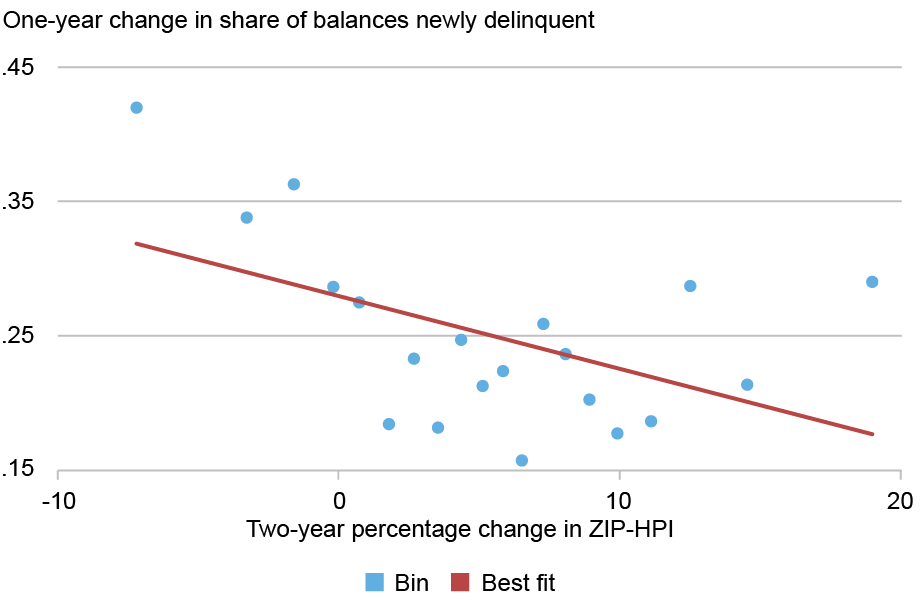
Notes: Zip codes are grouped into twenty bins based on the change in Home Price Index (HPI), with the median change within each bin reported on the x-axis. Bins are weighted using 2022 population from the ACS at the zip code tabulation area (ZCTA). Flow delinquency rates are calculated by grouping borrowers by bins of ZIP-HPI change.
It is important to note that overall, mortgages continue to perform well by historical standards and have risen recently only after having reached artificially low levels during the pandemic due to the stimulus and forbearances available to borrowers at that time. On average, about 1.3 percent of mortgage balances became seriously delinquent during 2025—a share that looks very similar to the averages observed outside of the period around the Great Recession (when delinquencies exceeded 8 percent). Tight lending standards for mortgages have been a major contributor to this improvement; the median credit score of newly originated mortgages has remained persistently above 750 since 2009. Still, in lower-income areas and in areas experiencing worsening labor market or housing market conditions, we are seeing mortgage delinquencies grow at a fast pace.

Andrew F. Haughwout is an economic research advisor in the Federal Reserve Bank of New York’s Research and Statistics Group.

Donghoon Lee is an economic research advisor in the Federal Reserve Bank of New York’s Research and Statistics Group.

Daniel Mangrum is a research economist in the Federal Reserve Bank of New York’s Research and Statistics Group.

Joelle Scally is an economic policy advisor in the Federal Reserve Bank of New York’s Research and Statistics Group.

Wilbert van der Klaauw is an economic research advisor in the Federal Reserve Bank of New York’s Research and Statistics Group.
How to cite this post:
Andrew F. Haughwout, Donghoon Lee, Daniel Mangrum, Joelle W. Scally, and Wilbert van der Klaauw, “Where Are Mortgage Delinquencies Rising the Most?,” Federal Reserve Bank of New York Liberty Street Economics, February 10, 2026, https://doi.org/10.59576/lse.20260210
BibTeX: View |
Disclaimer
The views expressed in this post are those of the author(s) and do not necessarily reflect the position of the Federal Reserve Bank of New York or the Federal Reserve System. Any errors or omissions are the responsibility of the author(s).