In an April post, using millions of homeowners’ insurance contracts matched with property-level exposure and disaster risk, we showed that although households are insured, they are still “on the hook” because deductibles and coverage limits leave homeowners responsible for part of a loss. Because insurers cannot perfectly observe how well homeowners maintain or protect their properties (a problem known as “moral hazard”), contract terms such as deductibles can play an important role in balancing risk sharing and incentives. By requiring homeowners to bear part of a loss, insurers can preserve incentives for policyholders to take actions that reduce damage risk. In this post, we quantify the cost of keeping homeowners on the hook. How costly is moral hazard in homeowner’s insurance? How much risk must households retain to preserve these incentives? And, importantly, who ultimately bears that residual risk? The short answer is that keeping homeowners on the hook costs insurers relatively little, but it leaves households with substantial risk, especially those least able to absorb a large loss.
How Do We Estimate Moral Hazard?
We build and estimate a model of insurance contract design, drawing on the classic moral-hazard framework of Holmström. Moral hazard is inherently difficult to measure because the underlying actions are unobservable, and quantifying it also requires distinguishing a property’s underlying risk from the incentives created by its insurance contract. Our data and our model allow us to do this at the contract level: for millions of homes, we observe key contract terms, detailed measures of underlying property risk, and rich borrower and property characteristics. Combining these data with the model, we estimate how much households value protection from risk, the cost associated with moral hazard, and how much risk homeowners ultimately retain. We leave the technical details of the model and estimation to our paper and focus here on the economic intuition and main findings.
What Do the Estimated Results Tell Us?
The estimates reveal a meaningful trade-off between risk sharing and incentives. Households appear willing to pay substantially to transfer property risk to insurers, and this willingness to pay increases with both their risk aversion and the underlying riskiness of their properties. At the same time, the estimated direct cost associated with moral hazard is relatively modest. The reason is that insurers can limit moral hazard through contract terms such as deductibles and coverage limits, and leave households to bear some of the risk themselves and preserve incentives to protect the property. The economic consequences of moral hazard therefore show up not only in its direct cost to insurers, but also in the amount of risk that remains with homeowners. We estimate that this residual exposure is substantial: deductibles and coverage limits leave households exposed to 29 percent of expected losses, even though the direct estimated cost of moral hazard is small.
Who Is More on the Hook?
Financially Constrained Households
The contract-level estimates, which already account for property value, reveal substantial differences across households. Lower-FICO policyholders are estimated to be more risk averse, pay higher risk premia, face higher costs associated with moral hazard, and retain more uninsured exposure. The chart below plots the average estimate by FICO score decile. All four measures decline steadily as FICO scores rise.
Lower-FICO Households Are More Risk Averse, Pay More for Protection, and Keep More Risk.
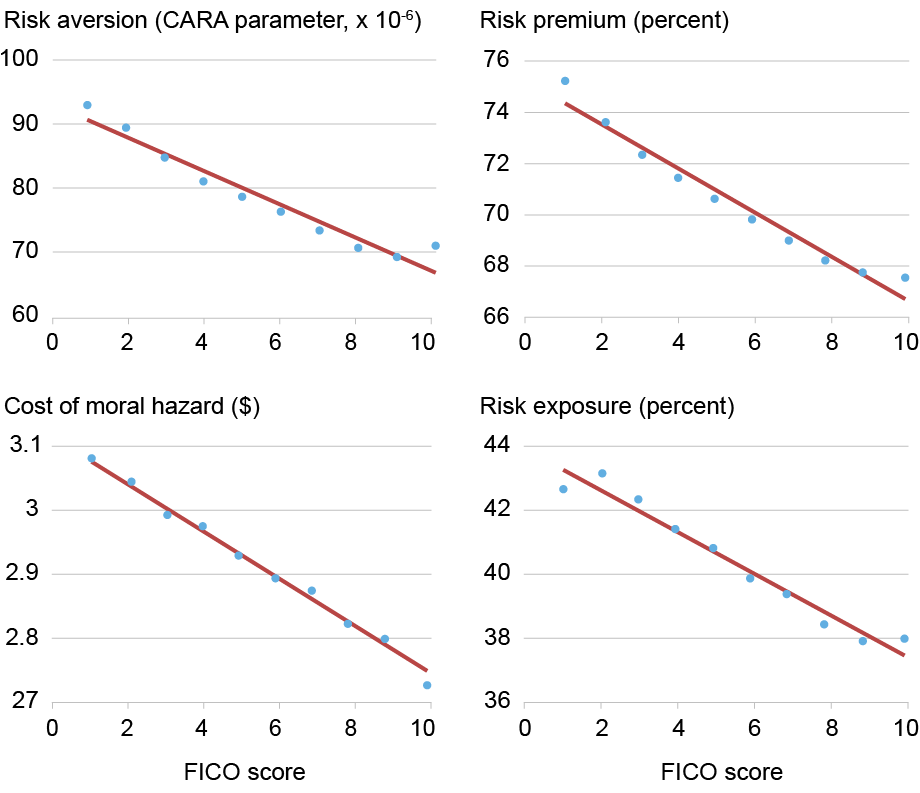
Note: Each panel plots the average estimated value by FICO score decile (1 = lowest scores, 10 = highest), with a linear fit.
One interpretation is that households with more limited financial resources absorb larger unexpected loss because they place greater value on transferring property risk to an insurer. Yet the contracts held by these households also leave them with more residual risk. Thus, paradoxically, the households that may have the greatest difficulty absorbing a disaster-related loss are also those whose insurance contracts leave them most exposed to one. These patterns are correlations, not causal estimates, and could also reflect other factors correlated with FICO scores, not financial constraint alone. The pattern is nonetheless informative about where residual risk concentrates.
Properties Facing Greater Tail Risk
Residual exposure is also higher for properties facing greater tail disaster risk. As shown in the bottom-right panel of the chart below, areas with greater exposure to severe disaster losses tend to be places where homeowners retain more risk through their insurance contracts.
Spatial Distribution of Risk Aversion, Risk Premia, Moral Hazard Costs, and Residual Exposure.
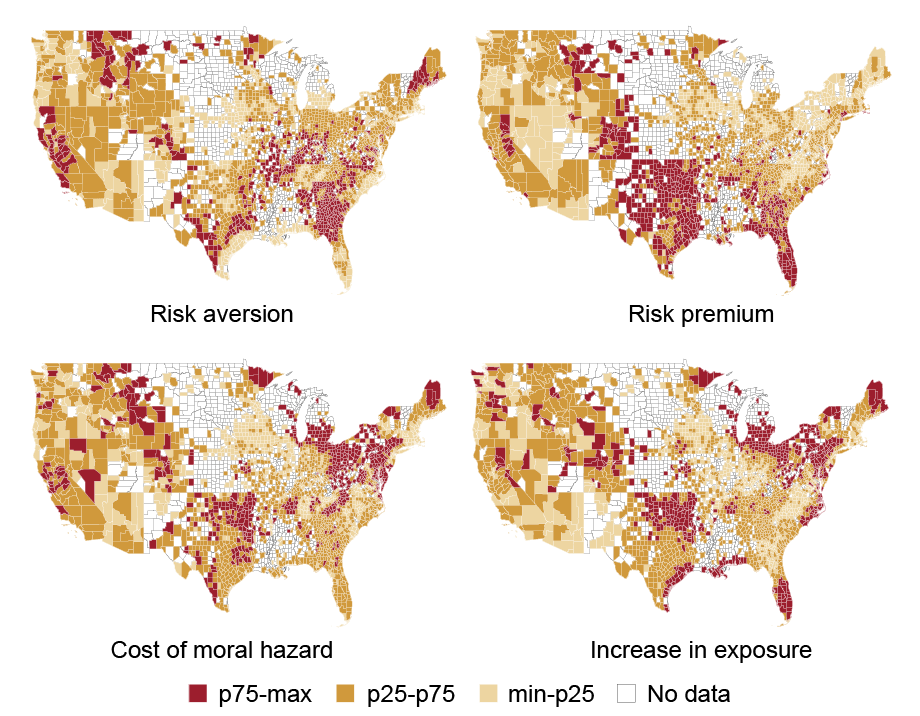
Note: Each panel shows the average estimate by county, grouped into quartiles. Red shading indicates higher values; white areas have no data.
More broadly, the maps show substantial geographic variation in estimated risk aversion, risk premia, moral-hazard costs, and residual exposure. These patterns reflect sharp differences in underlying property risk across locations, as well as differences in the households and insurers participating in these markets, among others.
Insurer Financial Conditions Also Matter
We also examine how the estimated quantities (risk aversion, risk premium, cost of moral hazard, and increase in exposure) vary with insurers’ financial conditions. More financially constrained insurers, measured using their risk-based capital ratios, tend to insure riskier properties and collect higher dollar risk premia. However, the risk premium as a share of the total premium is roughly flat across insurer financial constraints. In other words, higher premiums charged by more constrained insurers do not appear simply to reflect higher margins. Rather, these insurers tend to be matched with riskier properties and different types of policyholders. The results therefore suggest that insurer financial conditions are related not only to pricing but also to which risks insurers ultimately hold. More broadly, they point to the importance of accounting for the endogenous matching of households, properties, and insurers when studying the property insurance market.
Are We Really Estimating Moral Hazard?
Because moral hazard itself is not directly observable, we perform several validation exercises designed to test whether the estimated measure behaves in ways consistent with economic intuition.
We examine homeowners’ “skin in the game.” A household with a lower loan-to-value ratio has more equity invested in the property and therefore has stronger incentives to maintain it and limit avoidable damage. Consistent with this intuition, the estimated cost of moral hazard is lower among homeowners with lower loan-to-value ratios, even after controlling for borrower and property characteristics.
We use differences in insurance regulation across states. Some states impose inspection or verification requirements that can reduce information asymmetry on how the property has been managed between insurers and homeowners. The estimated cost of moral hazard is lower in states with these types of requirements. These exercises are not intended to establish causal effects of leverage or regulation. Instead, they provide external checks that the model-based estimates move in directions consistent with the underlying economic mechanism.
Takeaways
Our estimates reveal a fundamental trade-off at the heart of homeowner’s insurance. The direct cost of moral hazard appears to be small, in part because insurers can mitigate moral hazard through contract terms that leave households bearing more of the risk. Crucially, this burden is not evenly distributed: lower-FICO households and homes facing the most severe tail risk retain more of that exposure. In other words, moral hazard may be relatively inexpensive for insurers to manage, but doing so can leave households, particularly more vulnerable households, carrying substantial residual disaster risk.
These findings are robust to a range of adjustments. Flood exposure, which is typically excluded from standard homeowners insurance policies, has little effect on the results when removed. We also account for non-disaster claims by comparing modeled damages with realized claims data; this adjustment also does not change the takeaway.
We are also testing the robustness of these estimates by extending the model to features such as competition among insurers and institutional details, including that mortgage lenders typically require borrowers to carry homeowners insurance. Across these extensions, the patterns across households, locations, and insurers hold.
Looking Ahead
The results raise a natural policy question: If deductibles and other contract features leave households exposed to property risk, particularly households with fewer financial resources, why not simply require insurers to provide more complete coverage? The answer is not obvious, because the same contract features that leave households exposed also help preserve incentives to maintain and protect the property. In a final companion post, we will use the model to examine this trade-off directly and ask what would happen if insurers were required to offer full insurance.

Hyeyoon Jung is a financial research economist in the Federal Reserve Bank of New York’s Research and Statistics Group.
Jaehoon (Kyle) Jung is an assistant professor at the NYU Stern School of Business.
How to cite this post:
Hyeyoon Jung and Jaehoon (Kyle) Jung, “Insured, but Still on the Hook: Who Bears the Most Risk in Homeowner’s Insurance?,” Federal Reserve Bank of New York Liberty Street Economics, October 5, 2026, https://doi.org/10.59576/lse.20261005
BibTeX: View |
Disclaimer
The views expressed in this post are those of the author(s) and do not necessarily reflect the position of the Federal Reserve Bank of New York or the Federal Reserve System. Any errors or omissions are the responsibility of the author(s).