Are Professional Forecasters Overconfident? – Liberty Street Economics


The post-COVID years have not been kind to professional forecasters, whether from the private sector or policy institutions: their forecast errors for both output growth and inflation have increased dramatically relative to pre-COVID (see Figure 1 in this paper). In this two-post series we ask: First, are forecasters aware of their own fallibility? That is, when they provide measures of the uncertainty around their forecasts, are such measures on average in line with the size of the prediction errors they make? Second, can forecasters predict uncertain times? That is, does their own assessment of uncertainty change on par with changes in their forecasting ability? As we will see, the answer to both questions sheds light of whether forecasters are rational. And the answer to both questions is “no” for horizons longer than one year but is perhaps surprisingly “yes” for shorter-run forecasts.
What Are Probabilistic Surveys?
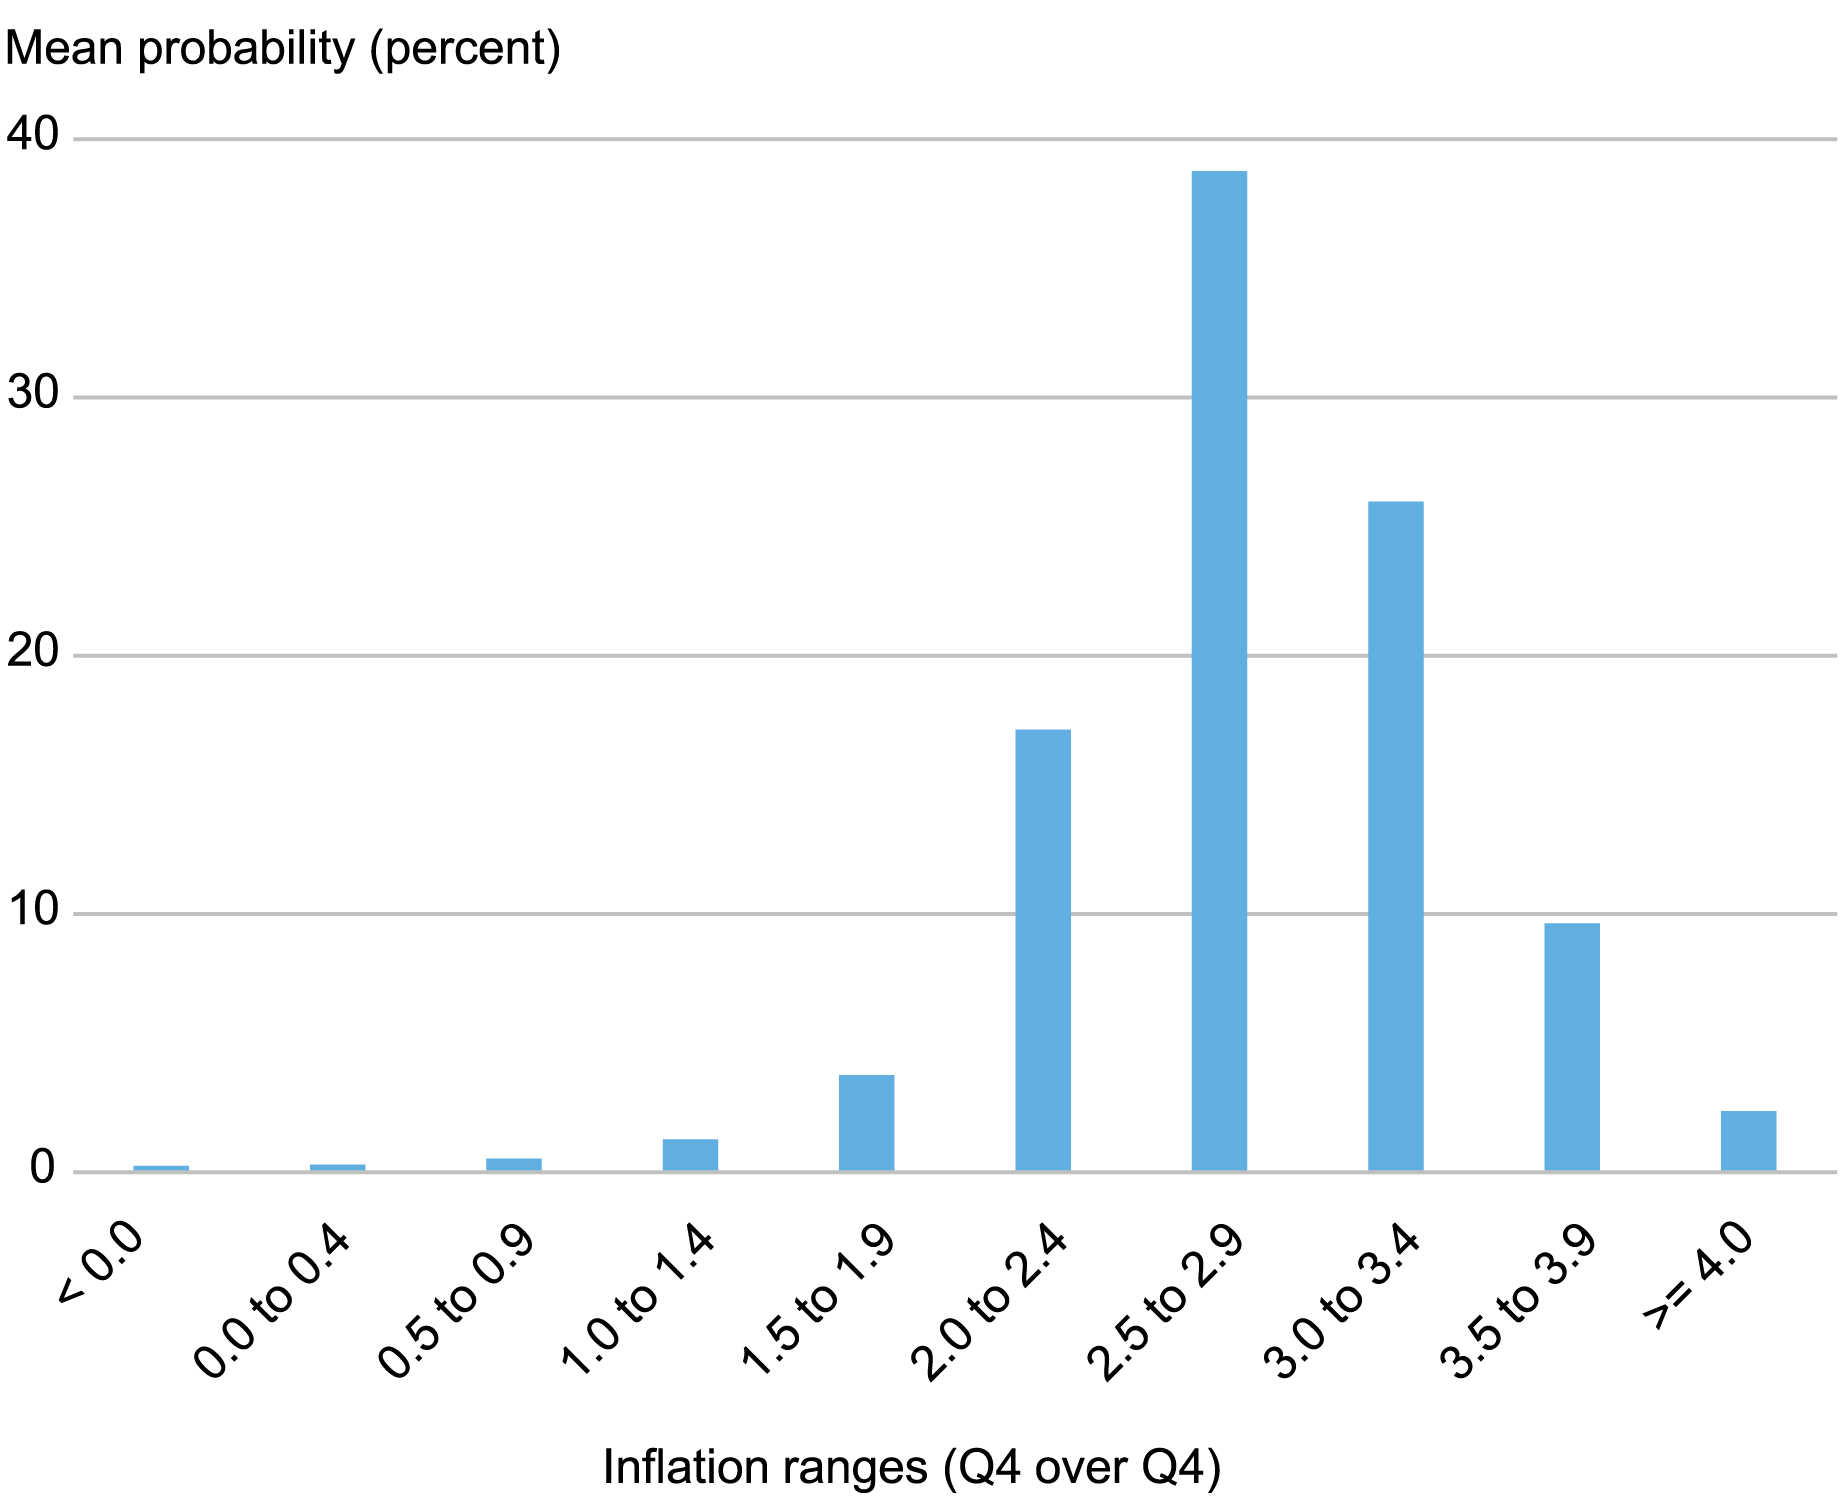
Let’s start by discussing the data. The Survey of Professional Forecasters (SPF), conducted by the Federal Reserve Bank of Philadelphia, elicits every quarter projections from a number of individuals who, according to the SPF, “produce projections in fulfillment of their professional responsibilities [and] have long track records in the field of macroeconomic forecasting.’’ These people are asked for point projections for a number of macro variables and also for probability distributions for a subset of these variables such as real output growth and inflation. The way the Philadelphia Fed asks for probability distributions is by dividing the real line (the interval between minus infinity and plus infinity) into “bins” or “ranges”—say, less than 0, 0 to 1, 1 to 2, …—and asking forecasters to put probabilities to each bin (see here for a recent example of the survey form). The result, when averaged across forecasters, is the histogram shown below for the case of core personal consumption expenditure (PCE) inflation projections for 2024 (also shown on the SPF site).
An Example of Answers to Probabilistic Surveys

Note: The chart plots mean probabilities for core PCE inflation in 2024.
So, for instance, in mid-May, forecasters expected on average a 40 percent probability that core PCE inflation in 2024 will be between 2.5 and 2.9 percent. Probabilistic surveys, whose study was pioneered by the economist Charles Manski, have a number of advantages compared to surveys that only ask for point projections: they provide a wealth of information that is not included in point projections, for example, on uncertainty and risks to the outlook. For this reason, probabilistic surveys have become more and more popular in recent years. The New York Fed’s Survey of Consumer Expectations (SCE), for example, is a shining example of a very popular probabilistic survey.
In order to obtain from probabilistic surveys information that is useful to macroeconomists—for example, measures of uncertainty—one has to extract the probability distribution underlying the histogram and use it to compute the object of interest; if one is interested in uncertainty, that would be the variance or an interquartile range. The way this is usually done (for instance, in the SCE) is to assume a specific parametric distribution (in the SCE case, a beta distribution) and to choose its parameters so that it best fits the histogram. In a recent paper with my coauthors Federico Bassetti and Roberto Casarin, we propose an alternative approach, based on Bayesian nonparametric techniques, that is arguably more robust as it depends less on the specific distributional assumption. We argue that for certain questions, such as whether forecasters are overconfident, this approach makes a difference.
The Evolution of Subjective Uncertainty for SPF Forecasters
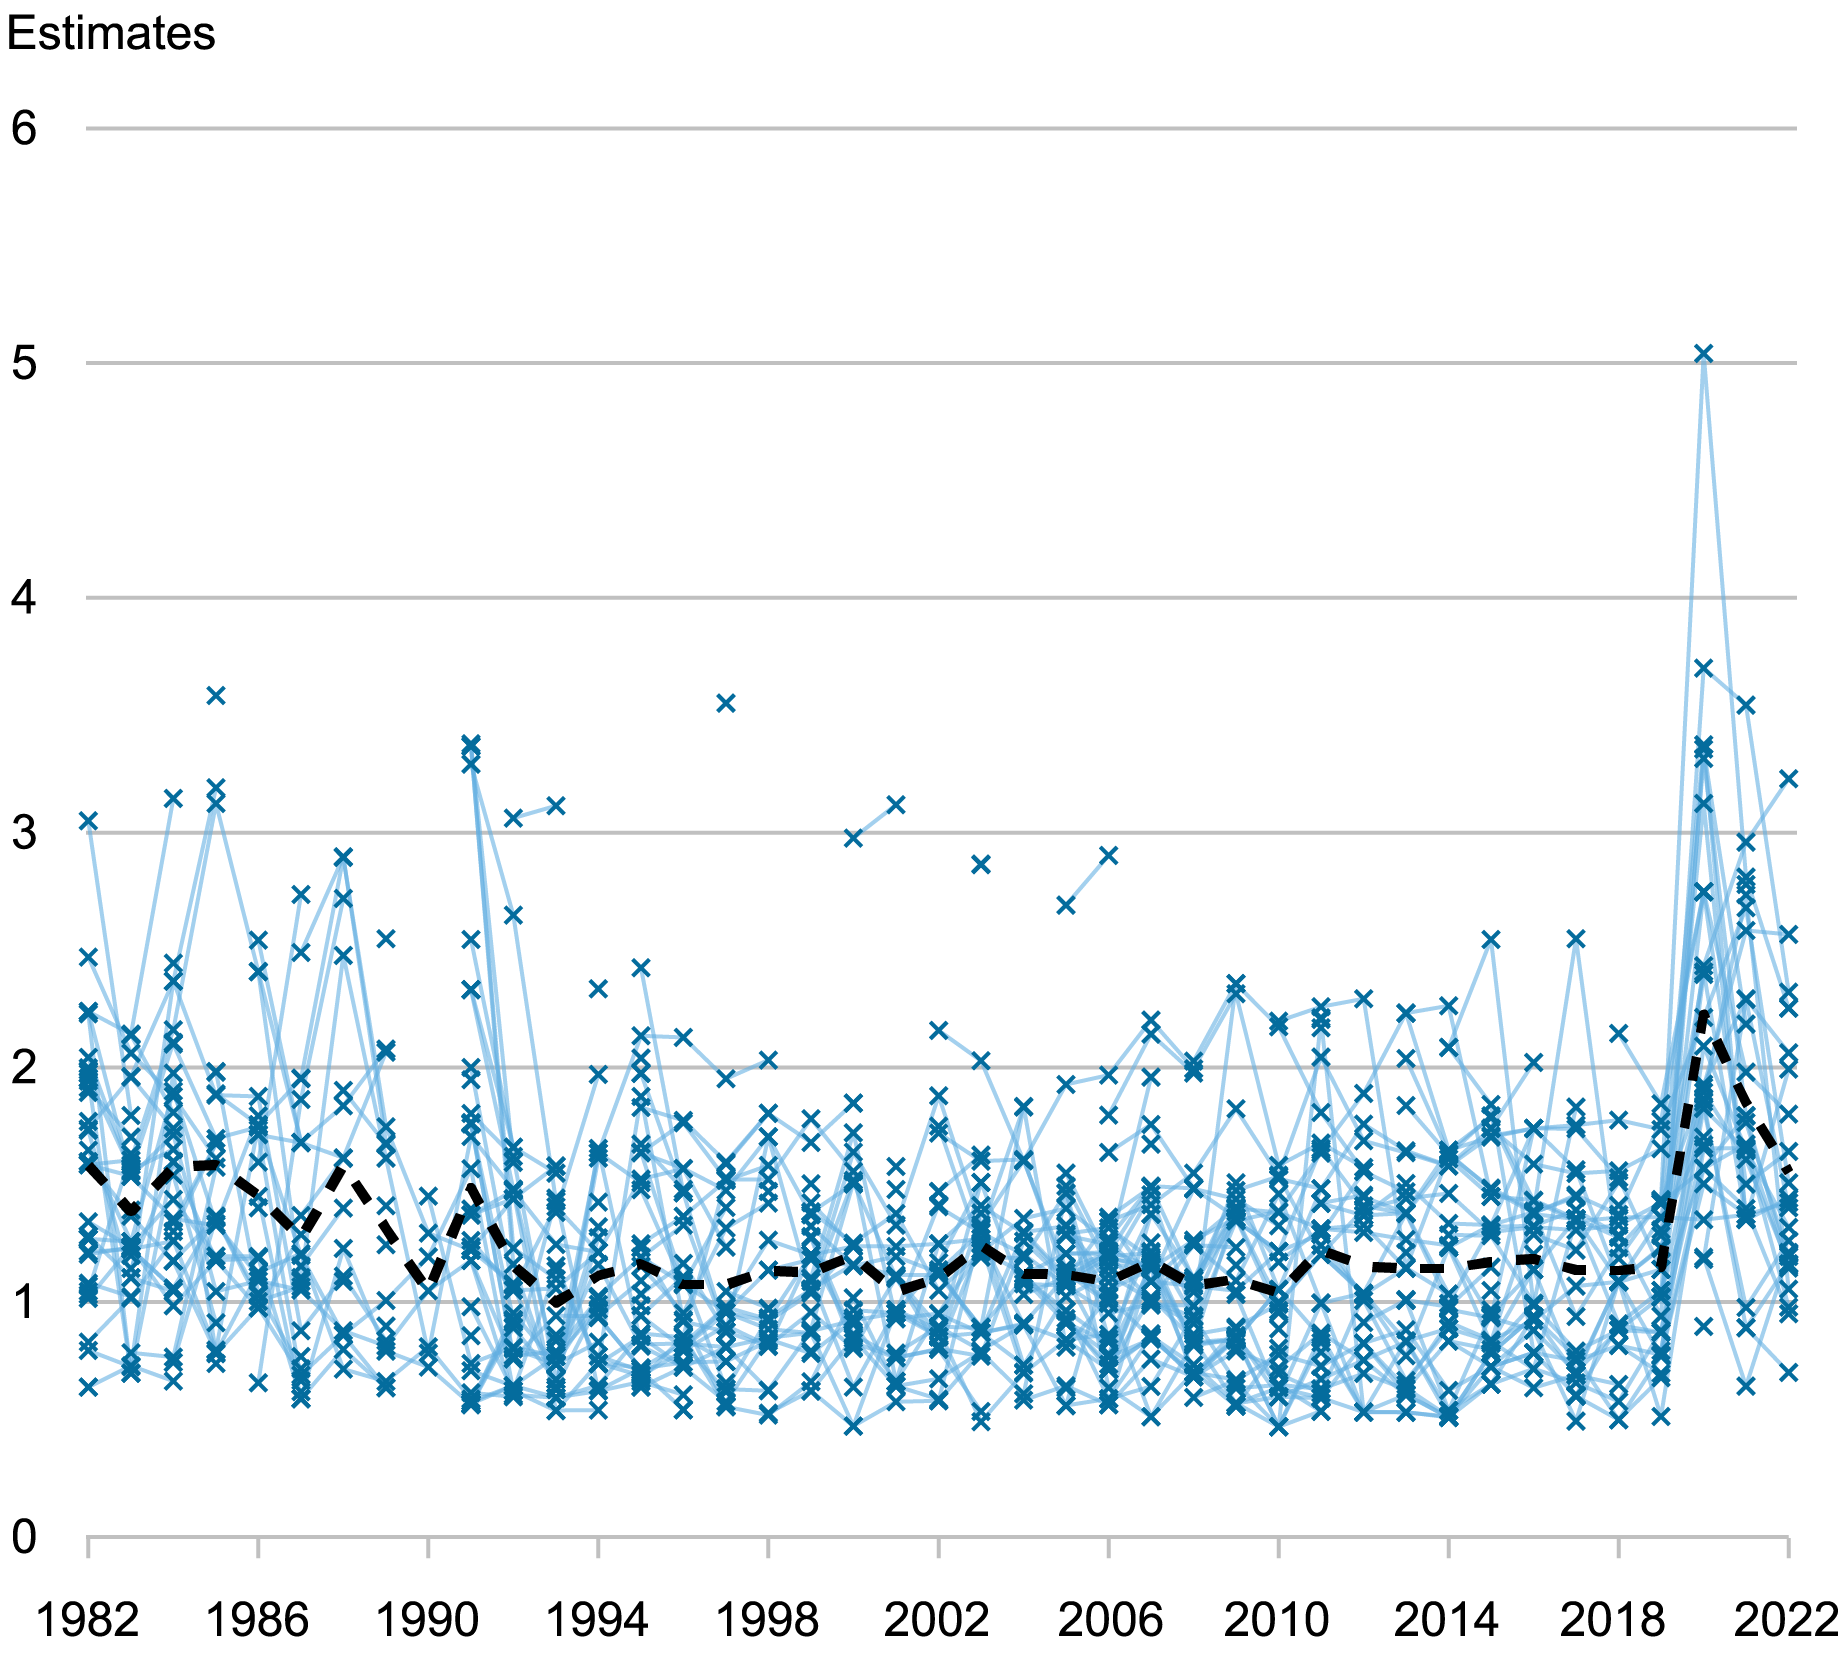
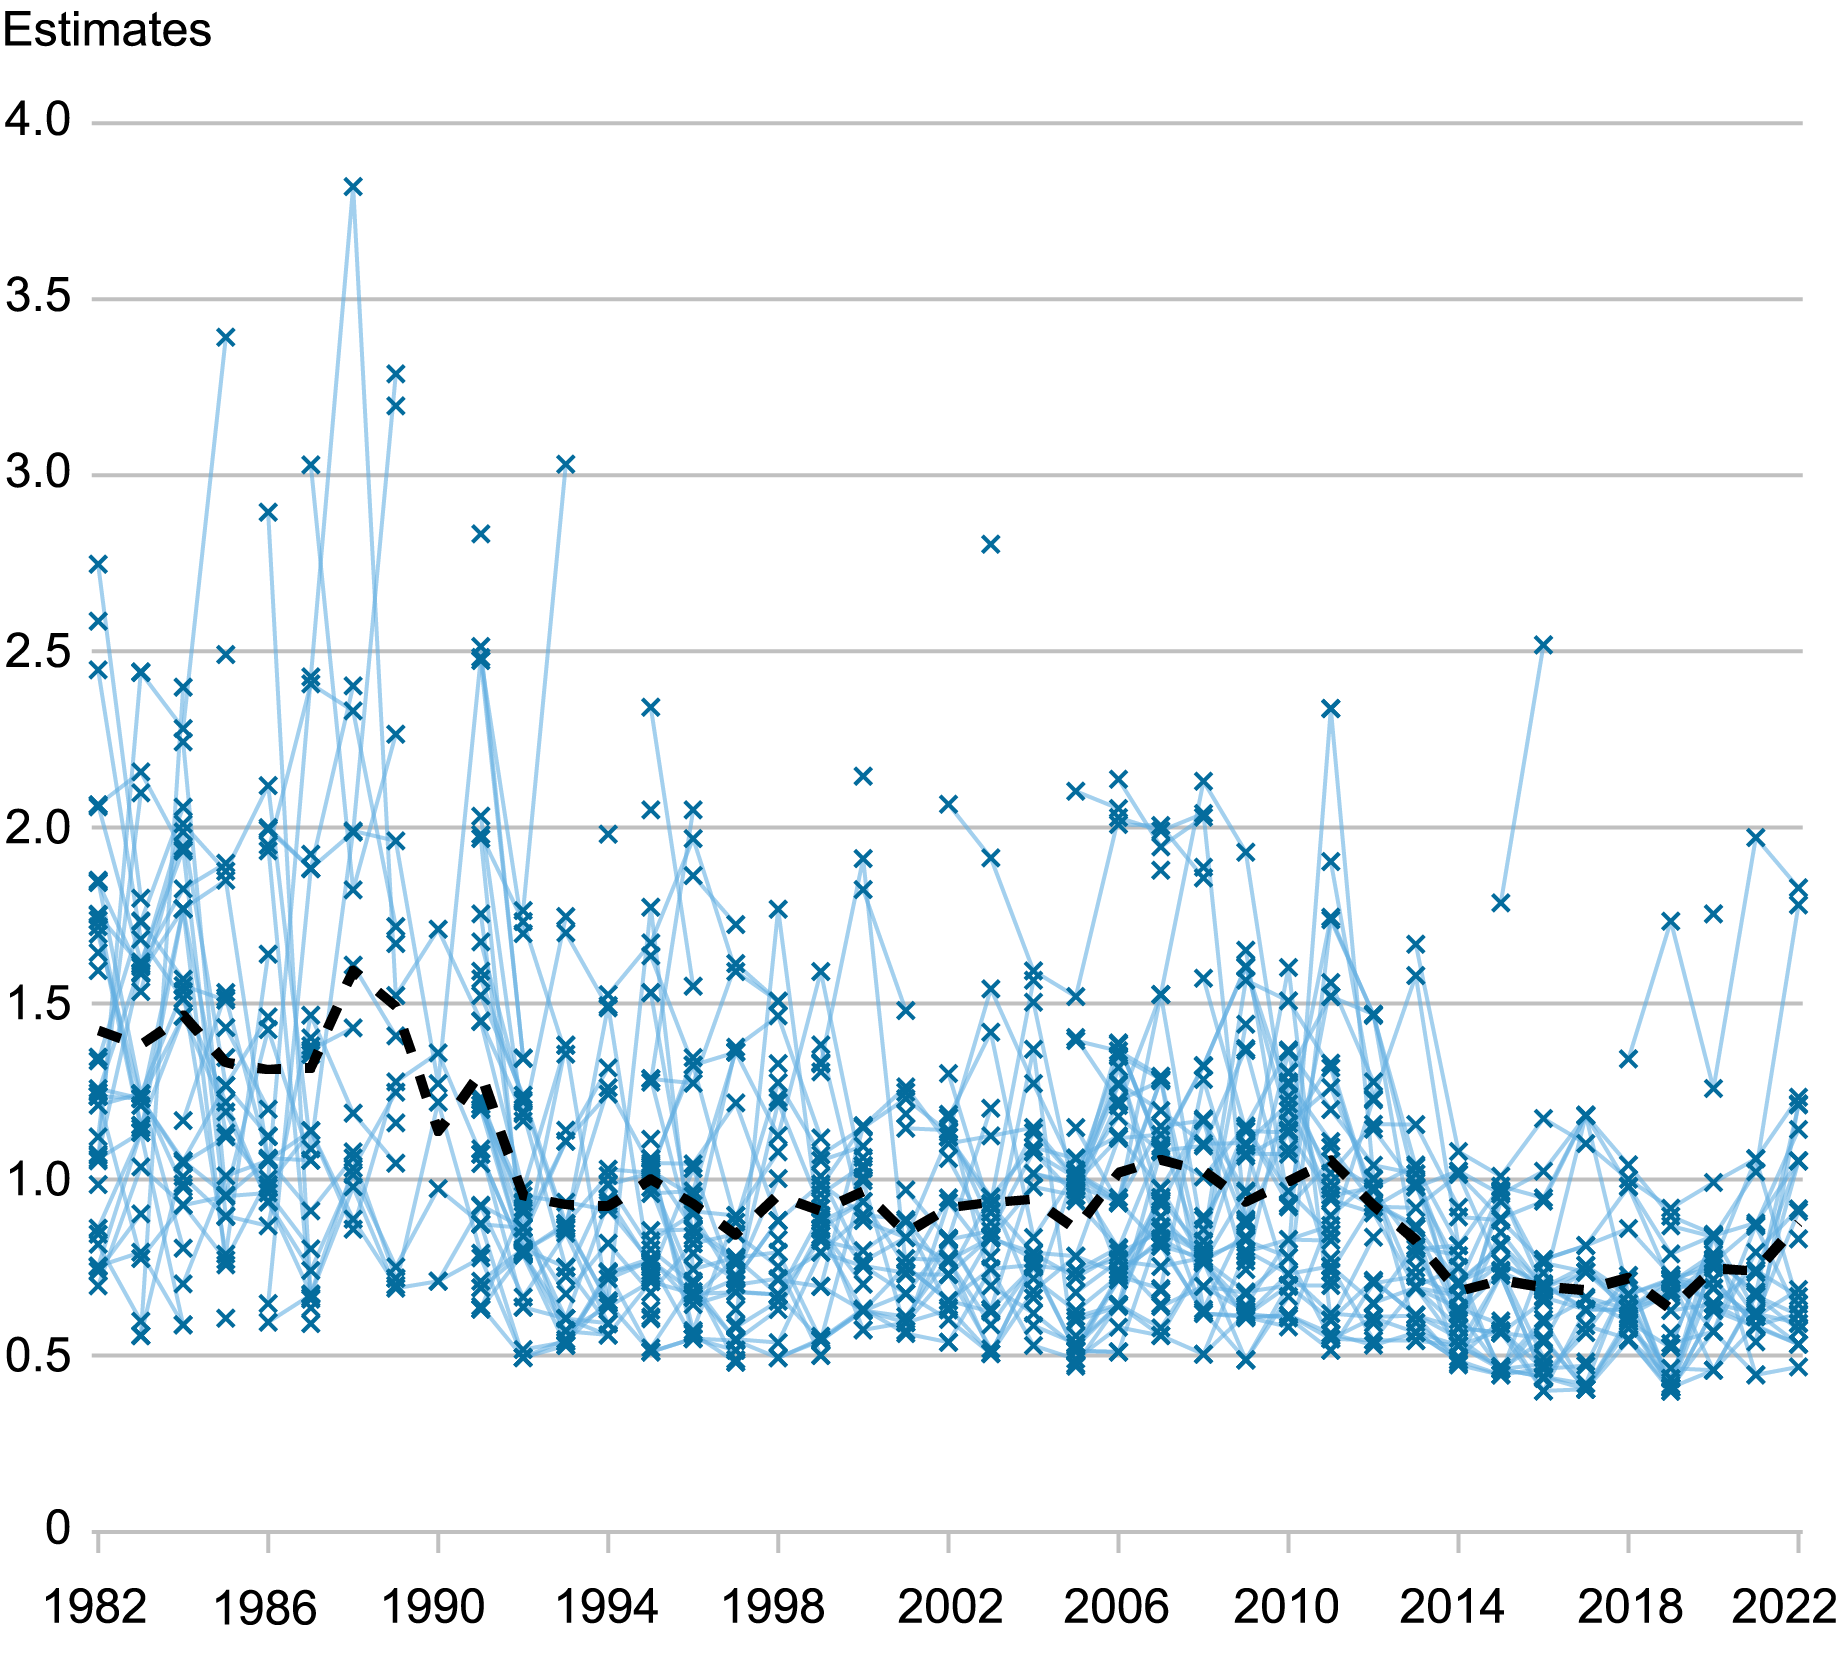
We apply our approach to individual probabilistic surveys for real output growth and GDP deflator inflation from 1982 to 2022. For each respondent and each survey, we then construct a measure of subjective uncertainty for both variables. The chart below plots these measures for next year’s output growth (that is, in 1982 this would be the uncertainty about output growth in 1983). Specifically, the thin blue crosses indicate the posterior mean of the standard deviation of the individual predictive distribution. (We use the standard deviation as opposed to the variance because its units are easily grasped quantitatively and are comparable with alternative measures of uncertainty such as the interquartile range, which we include in the paper’s appendix. Recall that the units of a standard deviation are the same as those of the variable being forecasted.) Thin blue lines connect the crosses across periods when the respondent is the same. This way you can see whether respondents change their view on uncertainty. Finally, the thick black dashed line shows the average uncertainty across forecasters in any given survey. In this chart we plot the result for the survey collected in the second quarter of each year, but the results for different quarters are very similar.
Subjective Uncertainty for Next Year’s Output Growth by Individual Respondent

Notes: Uncertainty (indicated by thin blue crosses) is measured by the posterior mean of the standard deviation of the predictive distribution for each respondent. The thick black dashed line shows the average uncertainty across forecasters in any given survey.
The chart shows that, on average, uncertainty for output growth projections declined from the 1980s to the early 1990s, likely reflecting a gradual learning about the Great Moderation (a period characterized by less volatility in business cycles), and then remained fairly constant up to the Great Recession, after which it ticked up toward a slightly higher plateau. Finally, in 2020, when the COVID pandemic struck, average uncertainty grew twofold. The chart also shows that differences in subjective uncertainty across individuals are very large and quantitatively trump any time variation in average uncertainty. The standard deviation of low-uncertainty individuals remains below one throughout most of the sample, while that of high-uncertainty individuals is often higher than two. The thin blue lines also show that while subjective uncertainty is persistent—low-uncertainty respondents tend to remain so—forecasters do change their minds over time about their own uncertainty.
The next chart shows that, on average, subjective uncertainty for next year’s inflation declined from the 1980s to the mid-1990s and then was roughly flat up until the mid-2000s. Average uncertainty rose in the years surrounding the Great Recession, but then declined again quite steadily starting in 2011, reaching a lower plateau around 2015. Interestingly, average uncertainty did not rise dramatically in 2020 through 2022 despite COVID and its aftermath, and despite the fact that, for most respondents, mean inflation forecasts (and the point predictions) rose sharply.
Subjective Uncertainty for Next Year’s Inflation by Individual Respondent

Notes: Uncertainty (indicated by the thin blue crosses) is measured by the posterior mean of the standard deviation of the predictive distribution for each respondent. The thick black dashed line shows the average uncertainty across forecasters in any given survey.
Are Professional Forecasters Overconfident?
Obviously, the heterogeneity in uncertainty just documented flies in the face of full information rational expectations (RE): if all forecasters used the “true” model of the economy to produce their forecasts—whatever that is—they would all have the same uncertainty and this is clearly not the case. There is a version of RE, called noisy RE, that may still be consistent with the evidence: according to this theory, forecasters receive both public and private signals about the state of the economy, which they do not observe. Heterogeneity in the signals, and in their precision, explains the heterogeneity in their subjective uncertainty: forecasters receiving a poor/more precise signal have higher/lower subjective uncertainty. Still, under RE, their subjective uncertainty better match the quality of their forecasts as measured by their forecast error—that is, forecasters should be neither over- nor under-confident. We test this hypothesis by checking whether, on average, the ratio of ex-post (squared) forecast errors over subjective uncertainty, as measured by the variance of the predictive distribution, equals one.
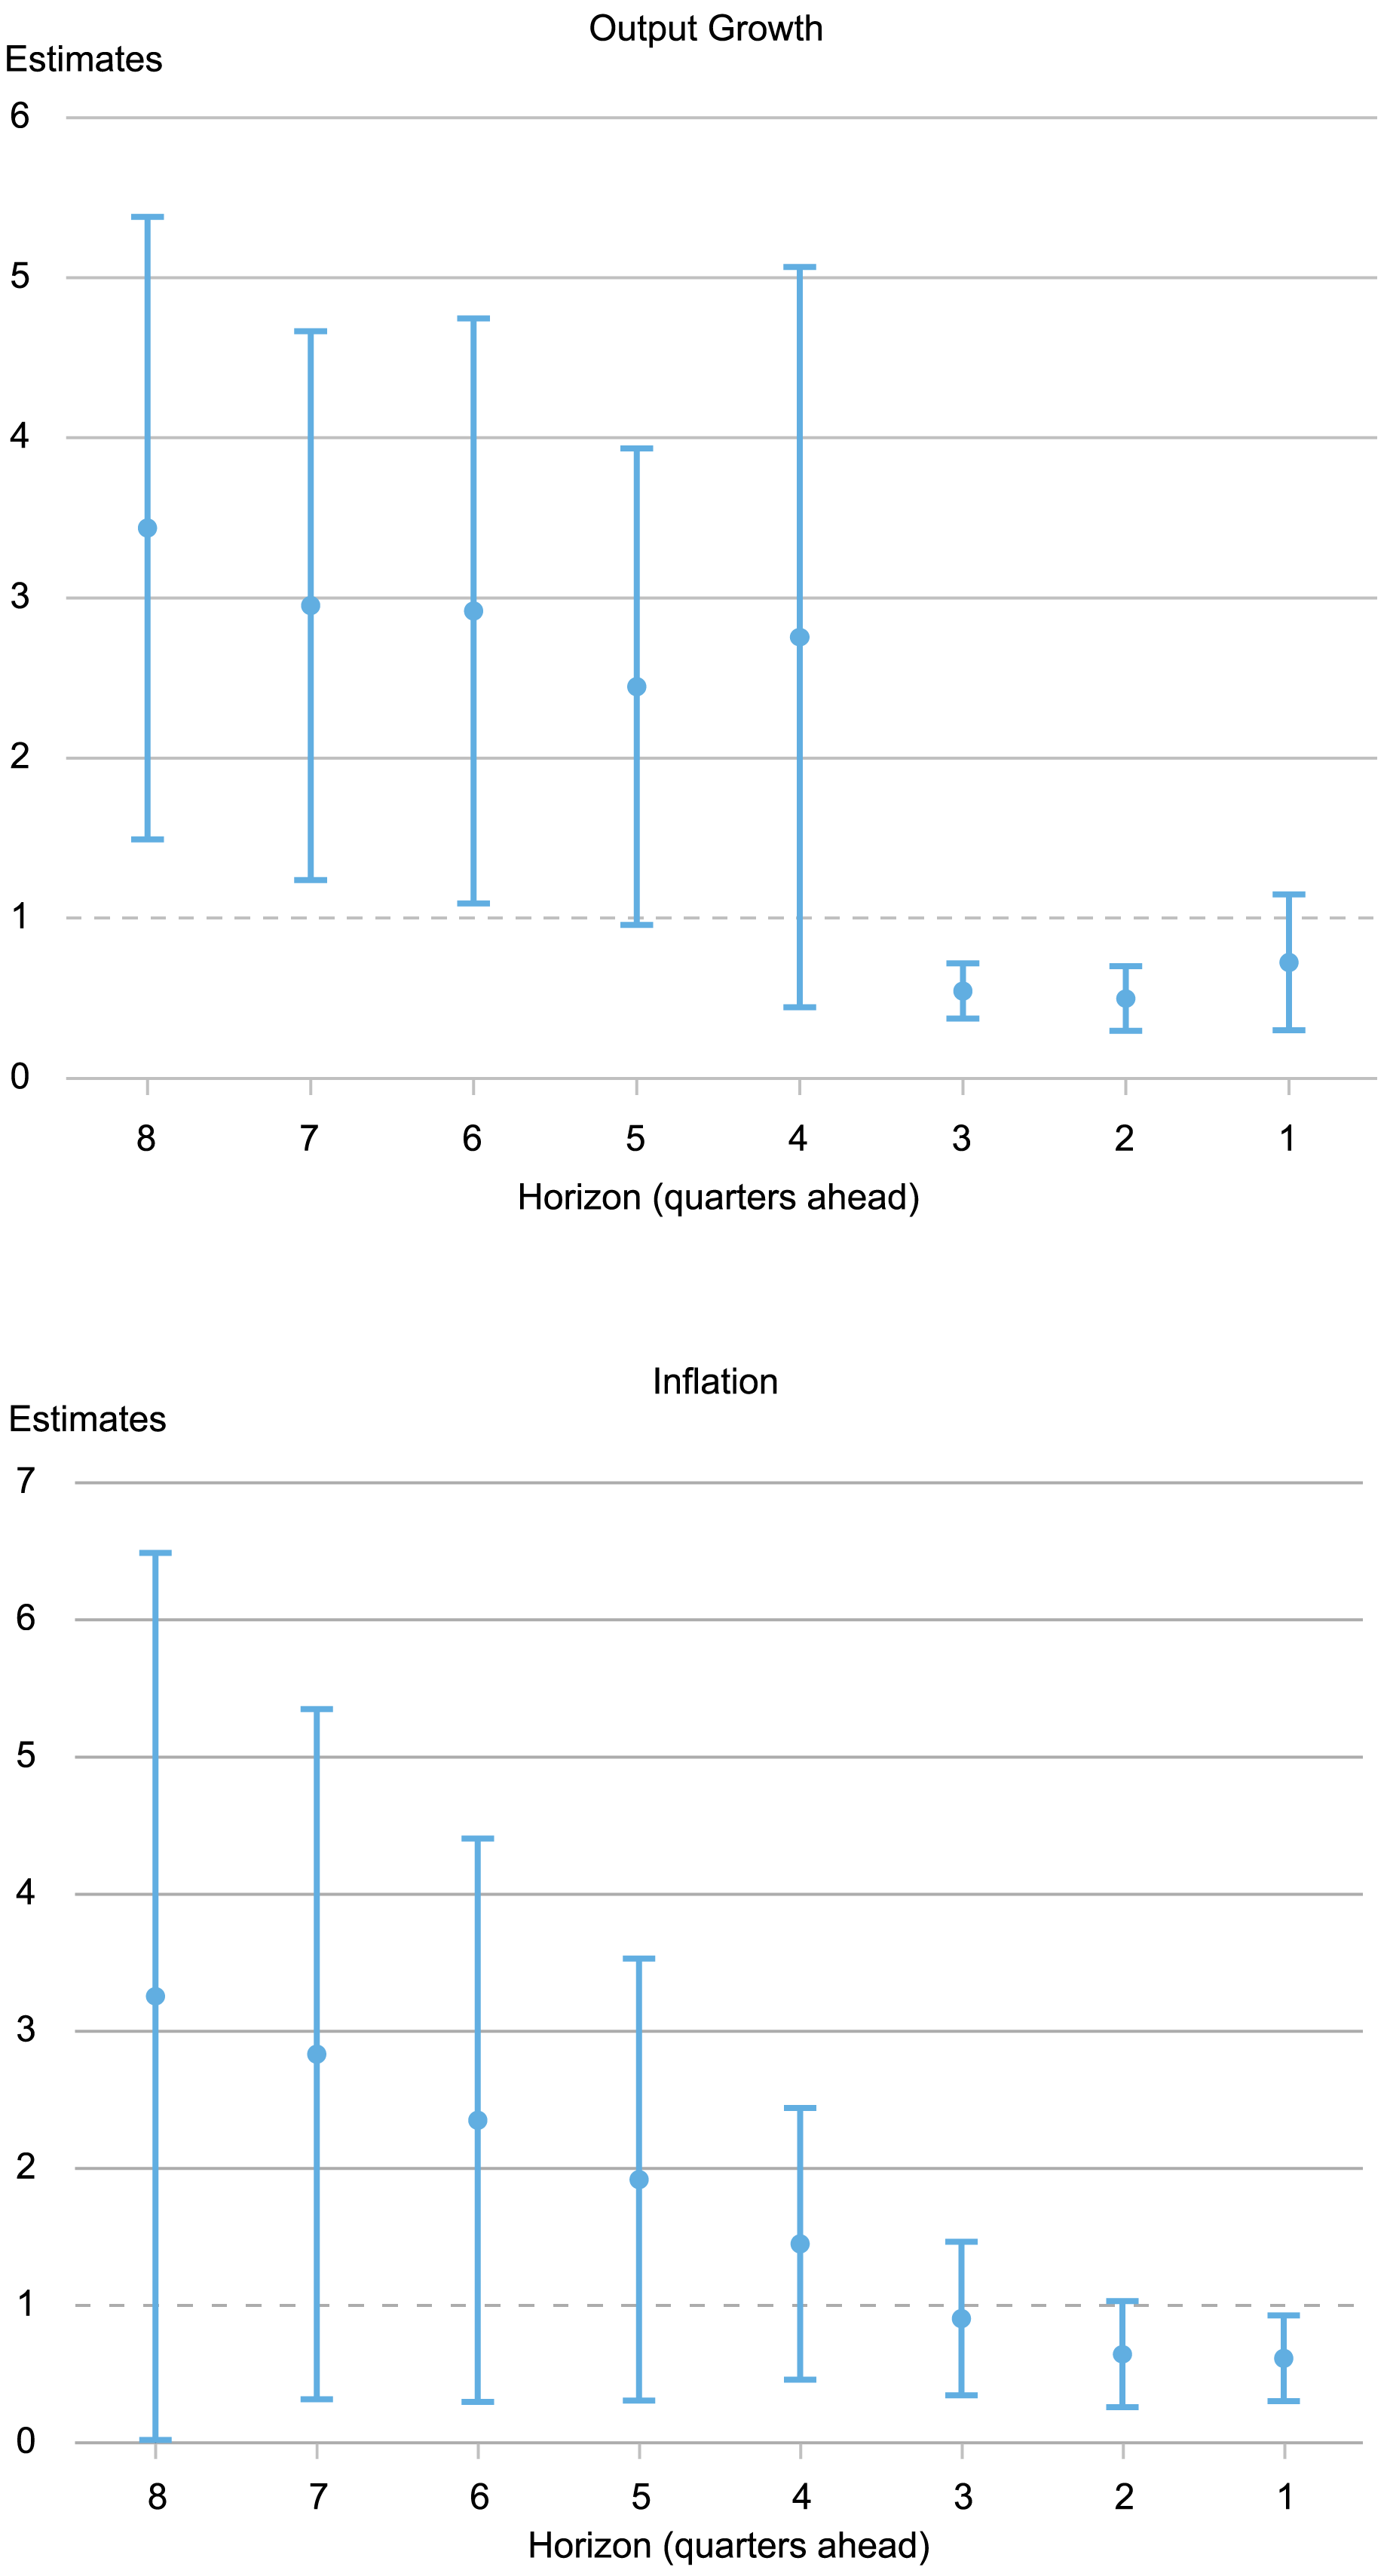
The thick dots in charts below show the average ratio of squared forecast errors over subjective uncertainty for eight to one quarters ahead (the eight-quarter-ahead measure uses the surveys conducted in the first quarter of the year before the realization; the one-quarter-ahead measure uses the surveys conducted in the fourth quarter of the same year), while the whiskers indicate 90 percent posterior coverage intervals based on Driscoll-Kraay standard errors.
Do Forecasters Over- or Under- Estimate Uncertainty?

Notes: The dots show the average ratio of squared forecast errors over subjective uncertainty for eight to one quarters-ahead. The whiskers indicate 90 percent posterior coverage intervals based on Driscoll-Kraay standard errors.
We find that for long horizons—between two and one years—forecasters are overconfident by a factor ranging from two to four for both output growth and inflation. But the opposite is true for short horizons: on average forecasters overestimate uncertainty, with point estimates lower than one for horizons less than four quarters (recall that one means that ex-post and ex-ante uncertainty are equal, as should be the case under RE). The standard errors are large, especially for long horizons. For output growth, the estimates are significantly above one for horizons greater than six, but, for inflation, the 90 percent coverage intervals always include one. We show in the paper that this pattern of overconfidence at long horizons and underconfidence at short horizons is robust across different sub-samples (e.g., excluding the COVID period), although the degree of overconfidence for long horizons changes with the sample, especially for inflation. We also show that it makes a big difference whether one uses measures of uncertainty from our approach or that obtained from fitting a beta distribution, especially at long horizons.
While the findings are in line with the literature on overconfidence (see the volume edited by Malmendier and Taylor [2015]) for output for horizons greater than one year, results are more uncertain for inflation. For horizons shorter than three quarters, the evidence shows that forecasters if anything overestimate uncertainty for both variables. What might explain these results? Patton and Timmermann (2010) show that dispersion in point forecasts increases with the horizon and argue that this result is consistent with differences not just in information sets, as the noisy RE hypothesis assumes, but also in priors/models, and where these priors matter more for longer horizons. In sum, for short horizons forecasters are actually slightly better at forecasting than they think they are. For long horizons, they are a lot worse at forecasting and they are not aware of it.
In today’s post we looked at the average relationship between subjective uncertainty and forecast errors. In the next post we will look at whether differences in uncertainty across forecasters and/or over time map into differences in forecasting accuracy. We will see that again the forecast horizon matters a lot for the results.

Marco Del Negro is an economic research advisor in Macroeconomic and Monetary Studies in the Federal Reserve Bank of New York’s Research and Statistics Group.
How to cite this post:
Marco Del Negro , “Are Professional Forecasters Overconfident? ,” Federal Reserve Bank of New York Liberty Street Economics, September 3, 2024, https://libertystreeteconomics.newyorkfed.org/2024/09/are-professional-forecasters-overconfident/.
Disclaimer
The views expressed in this post are those of the author(s) and do not necessarily reflect the position of the Federal Reserve Bank of New York or the Federal Reserve System. Any errors or omissions are the responsibility of the author(s).


