

This post is the second in a three-part series on how bank regulation interacts with the organizational structure of banking firms. The first post documented that nonbank subsidiaries inside bank holding companies (BHCs) are large, equity-rich “reservoirs,” and that bank-level capital diverged sharply from consolidated capital after Basel III took effect in 2015. This post asks why, and traces the answer through the internal plumbing of the holding company. The series draws on the authors’ recent Staff Report, “Regulatory Arbitrage Within the Firm.”
When Basel III’s binding capital minimums took effect for U.S. banks in January 2015, a bank holding company (BHC) whose depository subsidiary fell short of the new standards had two options. It could raise fresh equity in external markets, a costly option. Or, if it owned equity-rich nonbank affiliates, it could simply move capital from one subsidiary to another. The second route satisfies the regulator, avoids issuance costs, and leaves consolidated equity exactly where it was. In this second post of our series, we show that this is precisely what organizationally complex BHCs did in response to higher capital requirements.
More Capital at the Bank, None at the Holding Company
To identify differences in organizational complexity that predate Basel III, we exploit historical variation in interstate banking deregulation. States removed restrictions on interstate banking at different times during the 1970s, 1980s, and early 1990s. BHCs headquartered in states that deregulated earlier had more time to expand and build complex multi-subsidiary organizations before interstate banking restrictions were harmonized nationally in 1994. Those historical differences strongly predict organizational complexity decades later (as shown in the chart below), yet they are unlikely to be related to Basel III implementation three decades on. Consistent with this, early- and late-deregulating states show no divergence in nonbank activity before deregulation; the gap opens only afterward.
Deregulation Timing as an Instrument for Organizational Complexity
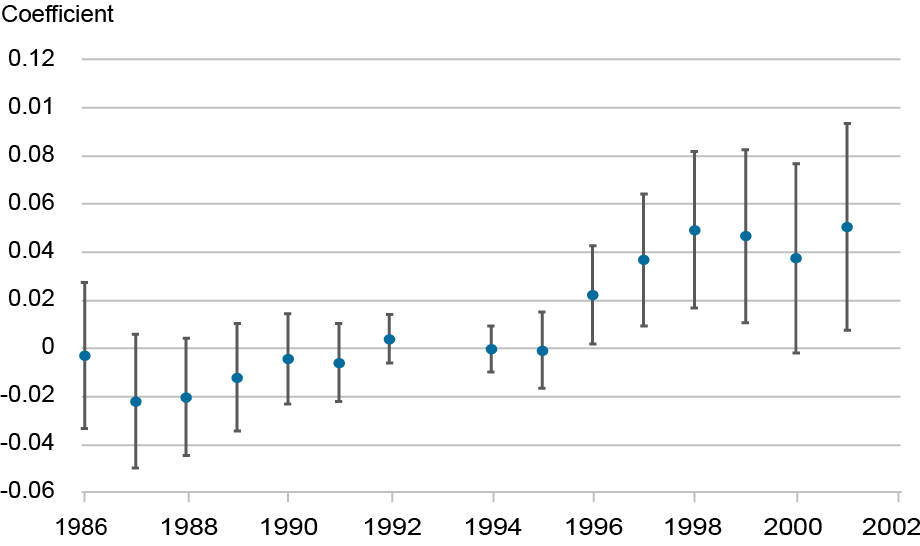
Notes: The chart shows the trends in nonbank financial subsidiary share from 1986–1994, between BHCs headquartered in early-deregulating states and late-deregulating states. Early deregulators are defined as states with median interstate deregulation year before 1986.
Using this variation, we find that banks in BHCs headquartered in states that deregulated one year earlier accumulate about three-quarters of a percentage point more excess capital after 2015. Given the roughly seven-year difference between early and late deregulators in our sample, this translates to about 5 percentage points more excess capital at the bank level. At the consolidated BHC level, the corresponding estimate is essentially zero. Consolidated assets, lending, and leverage are likewise unchanged.
A large bank-level effect paired with a null consolidated effect helps rule out the external-issuance story; new equity raised in markets would have lifted consolidated capital too. But we can also see the issuance margin directly. BHCs with greater deregulation exposure significantly reduce external equity issuance after 2015. Rather than tap markets to meet tighter requirements, complex BHCs reduce their reliance on outside investors. That is only possible if capital is available from elsewhere inside the organization.
Following the Money, Step by Step
The holding company’s own unconsolidated filings let us observe equity flows between parent and subsidiaries directly, and they reveal a clean three-step reallocation among BHCs with meaningful nonbank operations.
Step 1: The parent shifts equity toward banks. After 2015, parent equity investments in bank subsidiaries rise by 2.28 percentage points of total BHC equity per year of deregulation exposure, while investments in nonbank subsidiaries fall by a nearly identical 2.64 percentage points. Total parent investments across all subsidiaries are unchanged. The parent does not inject more capital into the organization; it changes where existing capital sits within it.
Step 2: The nonbanks supply the cash. Where do the funds for those equity injections come from? The answer appears in subsidiary dividend flows, shown in the table below. Following Basel III, dividends flowing from nonbank subsidiaries to the parent increase sharply. Dividends from bank subsidiaries, by contrast, show little change. The parent effectively draws resources from the less-regulated side of the organization while leaving the regulated bank side largely untouched.
Internal Equity Reallocation: Parent Investments and Subsidiary Dividends
| Parent Equity Investments | Dividends/ Equity | ||||
| Bank Share (1) |
Nonbank Share (2) |
Total Share (3) |
Bank Div./ Equity (4) |
Nonbank Div./Equity (5) |
|
| Years from deregulation x post | 0.0228** | -0.0264** | 0.0045 | 0.0000 | 0.0947** |
| (0.0093) | (0.0114) | (0.0104) | (0.0005) | (0.0459) | |
| Observations | 1,334 | 1,334 | 1,334 | 1,334 | 1,334 |
| R2 | 0.810 | 0.669 | 0.912 | 0.164 | 0.070 |
| BHC fixed effects | ✔ | ✔ | ✔ | ✔ | ✔ |
| Quarter-year fixed effects |
✔ | ✔ | ✔ | ✔ | ✔ |
| Controls x post | ✔ | ✔ | ✔ | ✔ | ✔ |
Notes: The table presents reduced-form estimates of internal equity reallocation within BHCs. The dependent variable in column 1 is equity investments in bank subsidiaries divided by total BHC equity. Column 2 is equity investments in nonbank subsidiaries divided by BHC equity. Column 3 is total equity investments in all subsidiaries divided by BHC equity. Equity investments include common stock, preferred stock, goodwill, and other intangibles. Column 4 is quarterly dividends received by parent from bank subsidiaries divided by lagged equity investment in banks. Column 5 is dividends from nonbank subsidiaries divided by lagged equity investment in nonbanks. Years from deregulation measures years between BHC headquarters state’s interstate branching deregulation and 1994 Riegle-Neal Act. Post indicates 2015:Q1 and later. All specifications include BHC fixed effects and quarter-year fixed effects. BHC controls include top 200 BHC indicator, log assets, leverage, ROA, deposits/assets, asset growth, and subsidiary count, all measured as of 2013:Q1 and interacted with post. Standard errors clustered at BHC level. Sample restricted to BHCs with nonbank asset share exceeding 1 percent.
*p<0.1, **p<0.05, ***p<0.01.
Step 3: Banks retain more earnings. Rather than distributing earnings upstream to the parent, banks increasingly retain them. Among BHCs with nonbank subsidiaries, retained earnings at bank subsidiaries rise substantially after 2015. Banks without access to nonbank affiliates show no comparable change.
Together, parent equity injections and increased earnings retention account for the bank capital buildup documented above, even as the flow of new capital into the consolidated organization declines. The money never enters the organization from outside; it moves within.
The Importance of the Equity Reservoir
The first post in this series introduced the idea that nonbank subsidiaries act as “equity reservoirs” because they hold a disproportionately large share of organizational equity relative to their assets. The size of that reservoir is captured by the equity multiplier: the nonbank share of consolidated equity relative to its share of assets, with larger values indicating more redeployable equity to draw on.
If those reservoirs are what make internal reallocation possible, then the response to Basel III should scale with the multiplier: among BHCs that operate both bank and nonbank subsidiaries, those with larger reservoirs should shift more equity toward their banks. That is exactly what we find. Each additional unit of the 2013 equity multiplier is associated with a 1.71 percentage point larger post-2015 increase in the share of consolidated equity invested in banks, and a 1.12 percentage point larger decline in the share invested in nonbanks.
The chart below shows the same relationship as a simple cross section. Each point is one BHC’s change in invested-equity share from before 2015 to after 2015, plotted against its 2013 equity multiplier. BHCs with larger reservoirs shift equity investment more sharply toward banks (left panel) and away from nonbanks (right panel). The availability of redeployable nonbank equity, not organizational complexity alone, determines how a BHC responds to tighter capital requirements.
Equity Reallocation Heterogeneity: Role of the Equity Multiplier
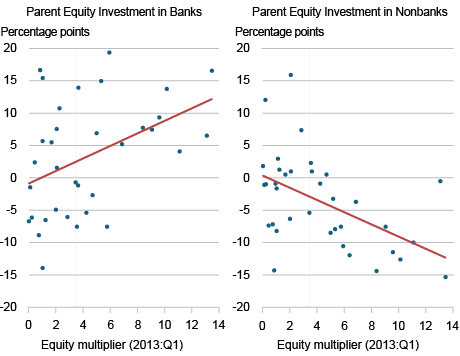
Notes: The chart plots each BHC’s pre-post mean difference in the outcome variable against the BHC’s 2013:Q1 equity multiplier. The left panel shows the change in parent equity invested in bank subsidiaries as a share of consolidated BHC equity. The right panel shows the change in equity invested in nonbank subsidiaries as a share of consolidated BHC equity. Both outcomes are expressed in percentage points. The sample consists of BHCs with at least 1 percent nonbank asset share in 2013:Q1. For visual clarity, the scatter is restricted to BHCs whose pre-post change is within +/- 20 percentage points; the fitted line and the slope reported in each panel are simple OLS estimates on this restricted cross section. The vertical dotted line marks the median equity multiplier across BHCs. *p<0.1, **p<0.05, ***p<0.01.
Capital Moves. Does Risk Move Too?
From the parent’s perspective, redistributing funds via its internal capital market is privately optimal. On the consolidated balance sheet, returns on assets and equity rise after Basel III while charge-offs fall, with no shift toward riskier assets. BHCs are not taking more risk in aggregate. Instead, they are reallocating capital across subsidiaries in response to differences in how those subsidiaries are regulated. But “no more risk in aggregate” does not mean no change in where risk sits.
In the final post of this series, we turn to the nonbank subsidiaries that supply this capital. We show that the same reallocation that strengthens banks weakens nonbank affiliates, shifts their activity toward riskier forms of lending, and creates a channel through which distress on the nonbank side of the organization can spill back onto the bank itself.

Nicola Cetorelli is head of Financial Intermediation in the Federal Reserve Bank of New York’s Research and Statistics Group.
Shohini Kundu is an assistant professor of finance at the UCLA Anderson School of Management and an assistant professor of law (by courtesy) at the UCLA School of Law.
How to cite this post:
Nicola Cetorelli and Shohini Kundu, “How Basel III Changes Where Capital Sits: Nonbank Subsidiaries as Equity Reservoirs,” Federal Reserve Bank of New York Liberty Street Economics, July 16, 2026, https://doi.org/10.59576/lse.20260716
BibTeX: View |
Disclaimer
The views expressed in this post are those of the author(s) and do not necessarily reflect the position of the Federal Reserve Bank of New York or the Federal Reserve System. Any errors or omissions are the responsibility of the author(s).